I think I almost daily podcast about my favorite neighborhood, so I decided it is time I do a dedicated market update for it. If you don’t know which neighborhood I am talking about, it is East Shore! Lol. I know a handful of residents that live there, and I am currently searching that area for a buyer, so it is always on my radar.
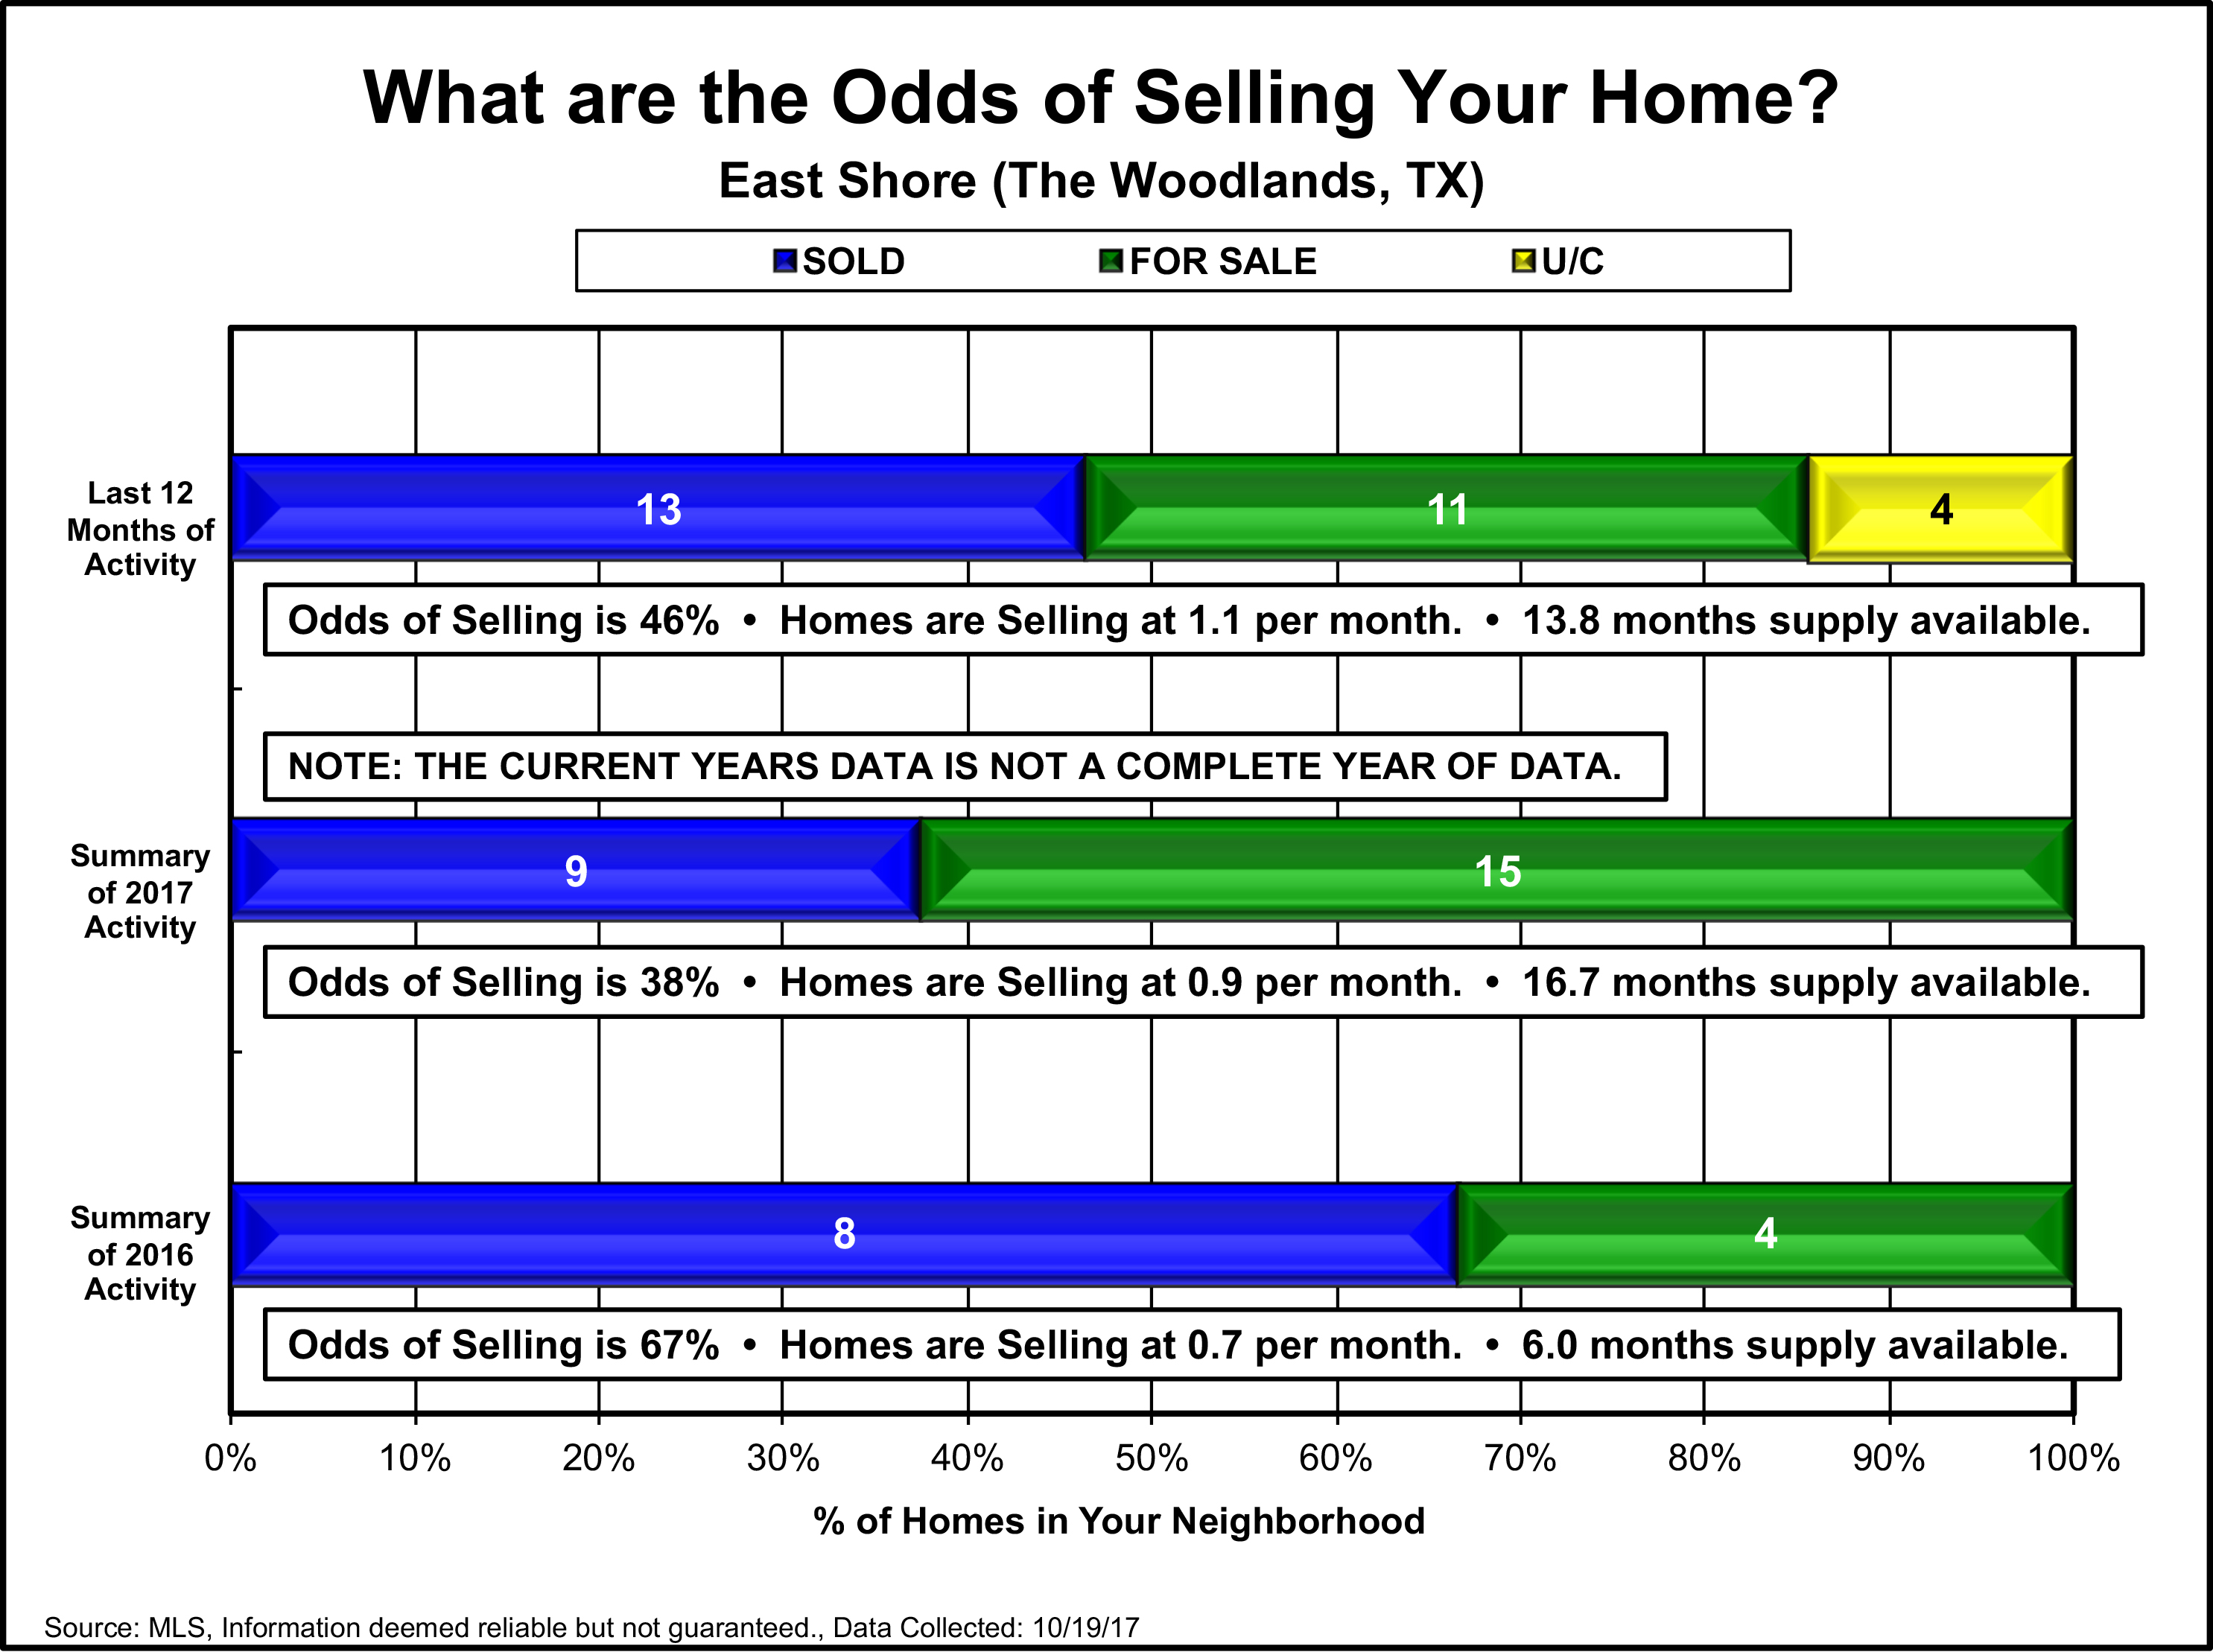 As you can see, there are currently 11 active homes for sale in East Shore, 4 pending, and year to date, 9 have sold, with only 8 selling in 2016 for the whole year. I am sure you can gather what this means, but the sales for 2017 appear to be up compared to 2016.
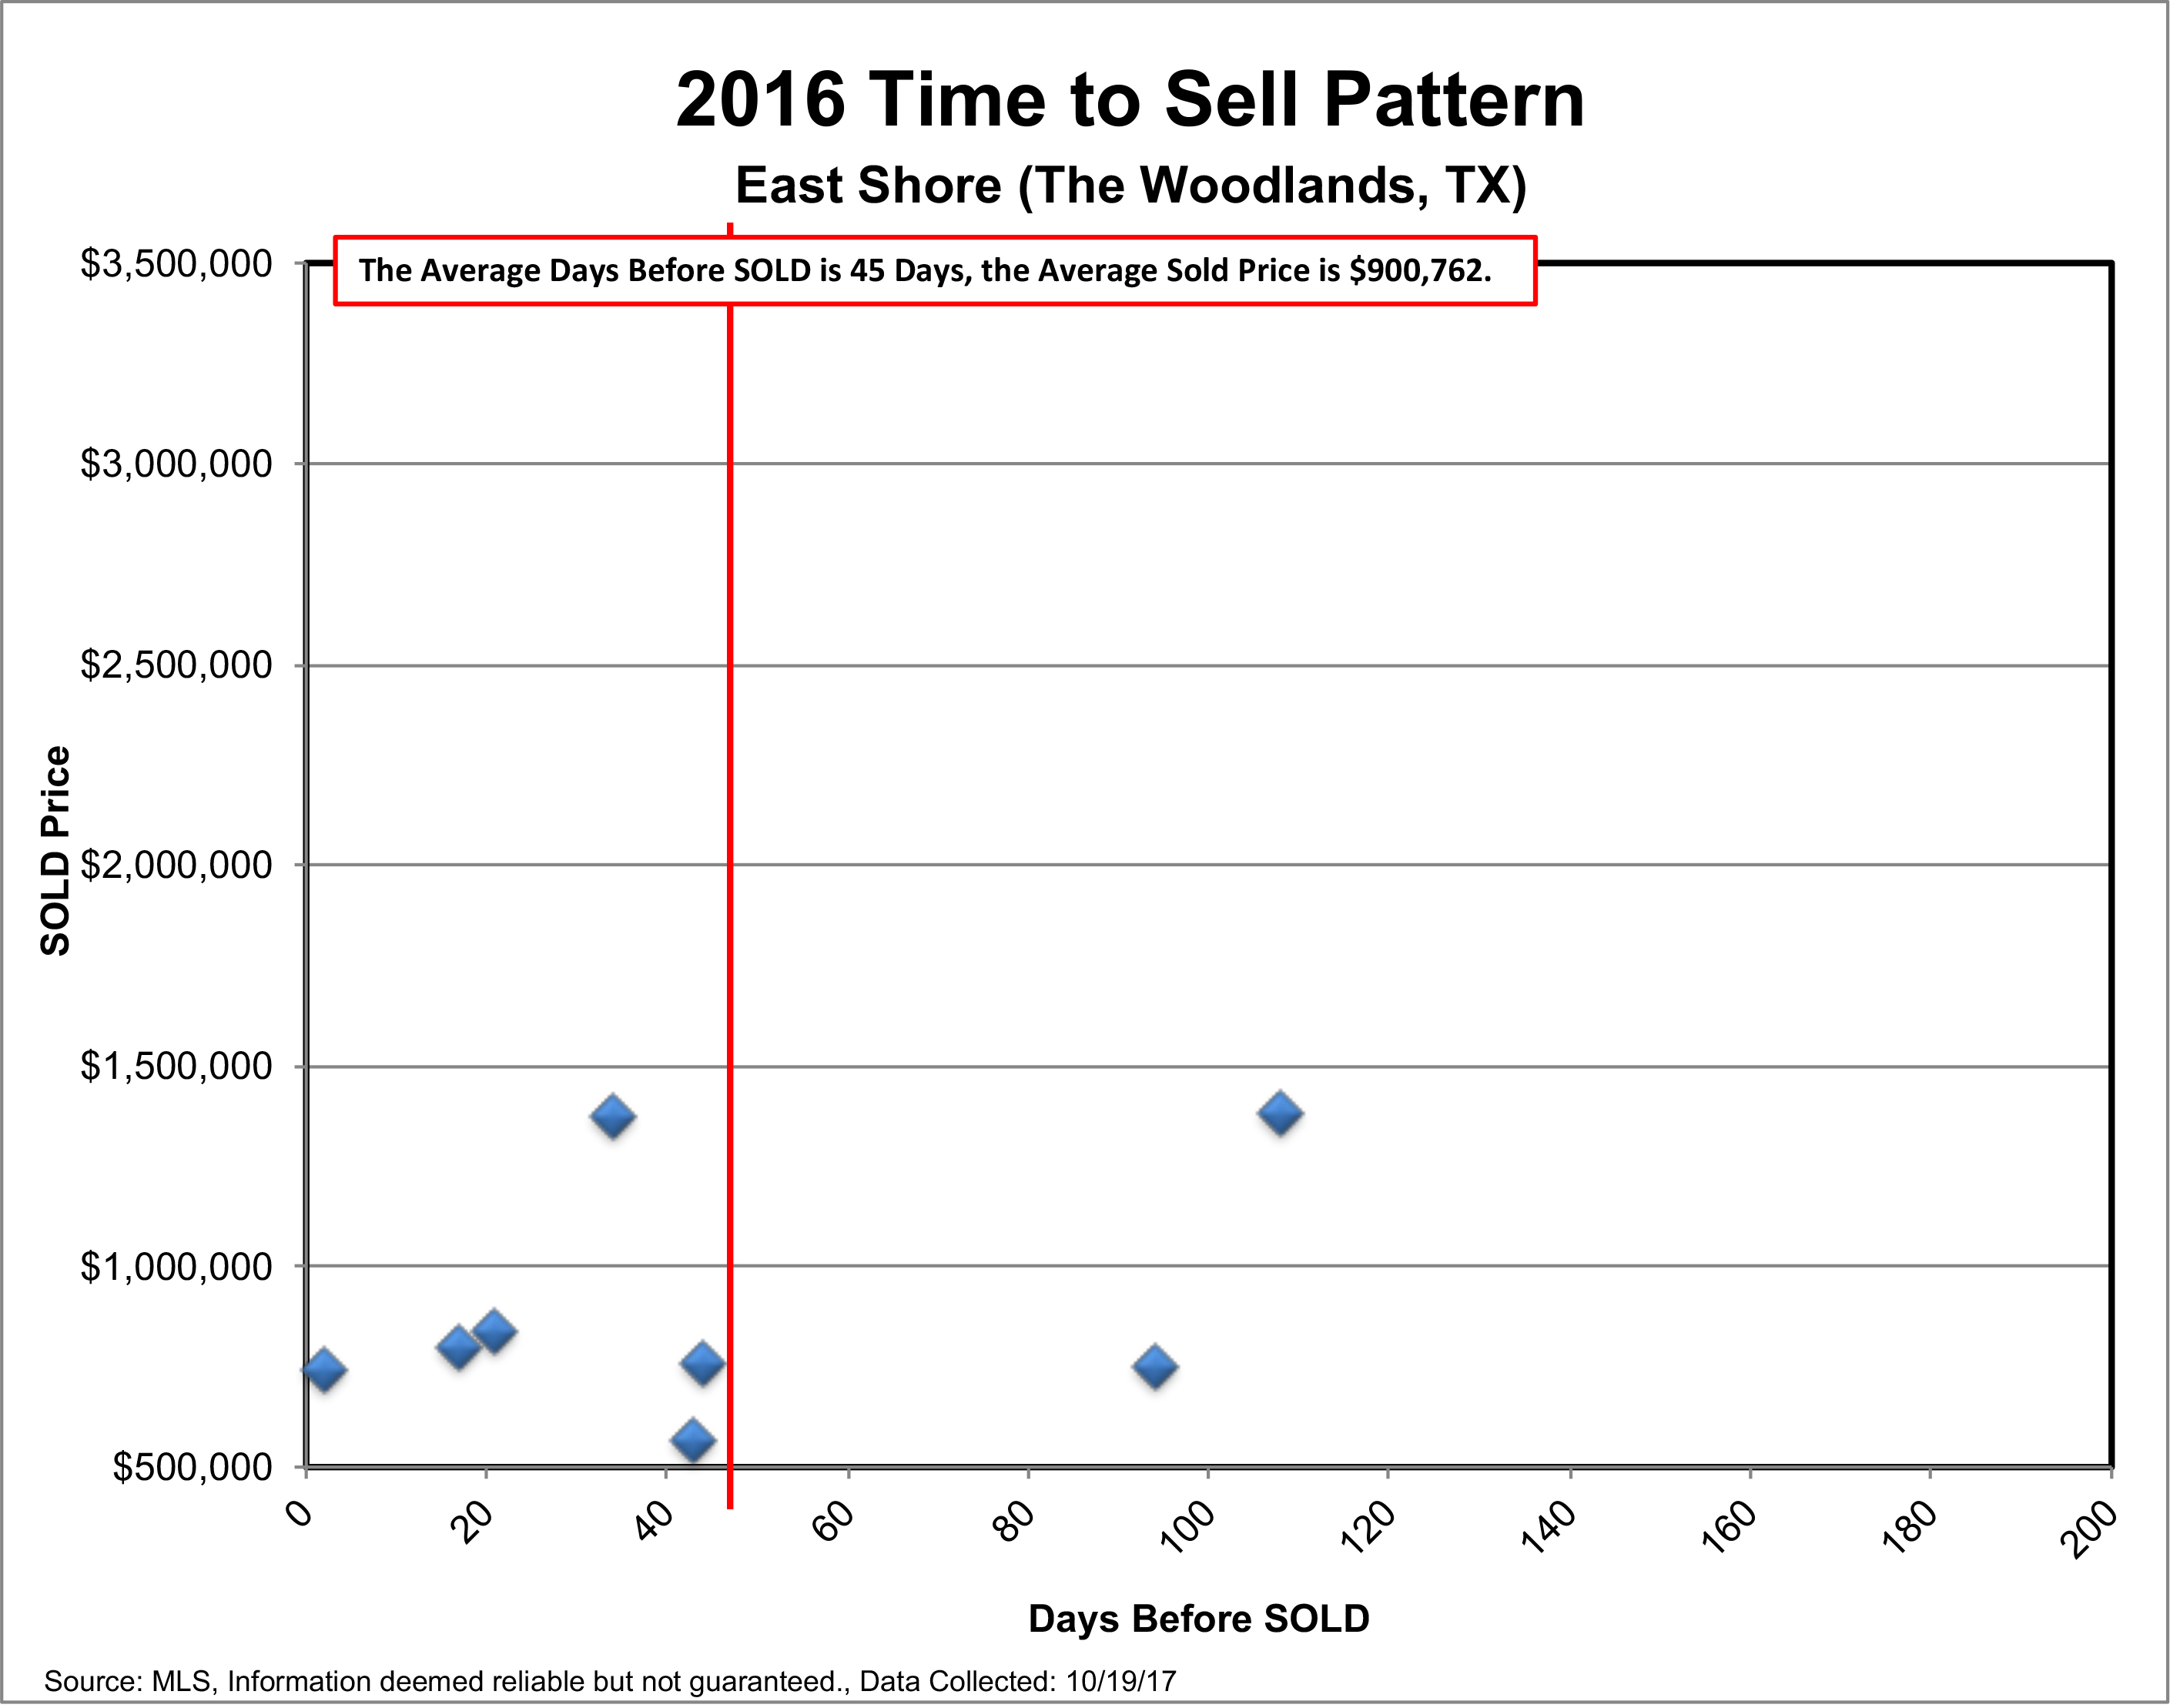 The next two graphs (the one above and the one below), compare 2016 to 2017. The average days on market in 2016 was 45 and so far year to date in 2017 is 49. This data is a little skewed because homes that expire, and are relisted, their accumulative days on the market is not computed correctly.
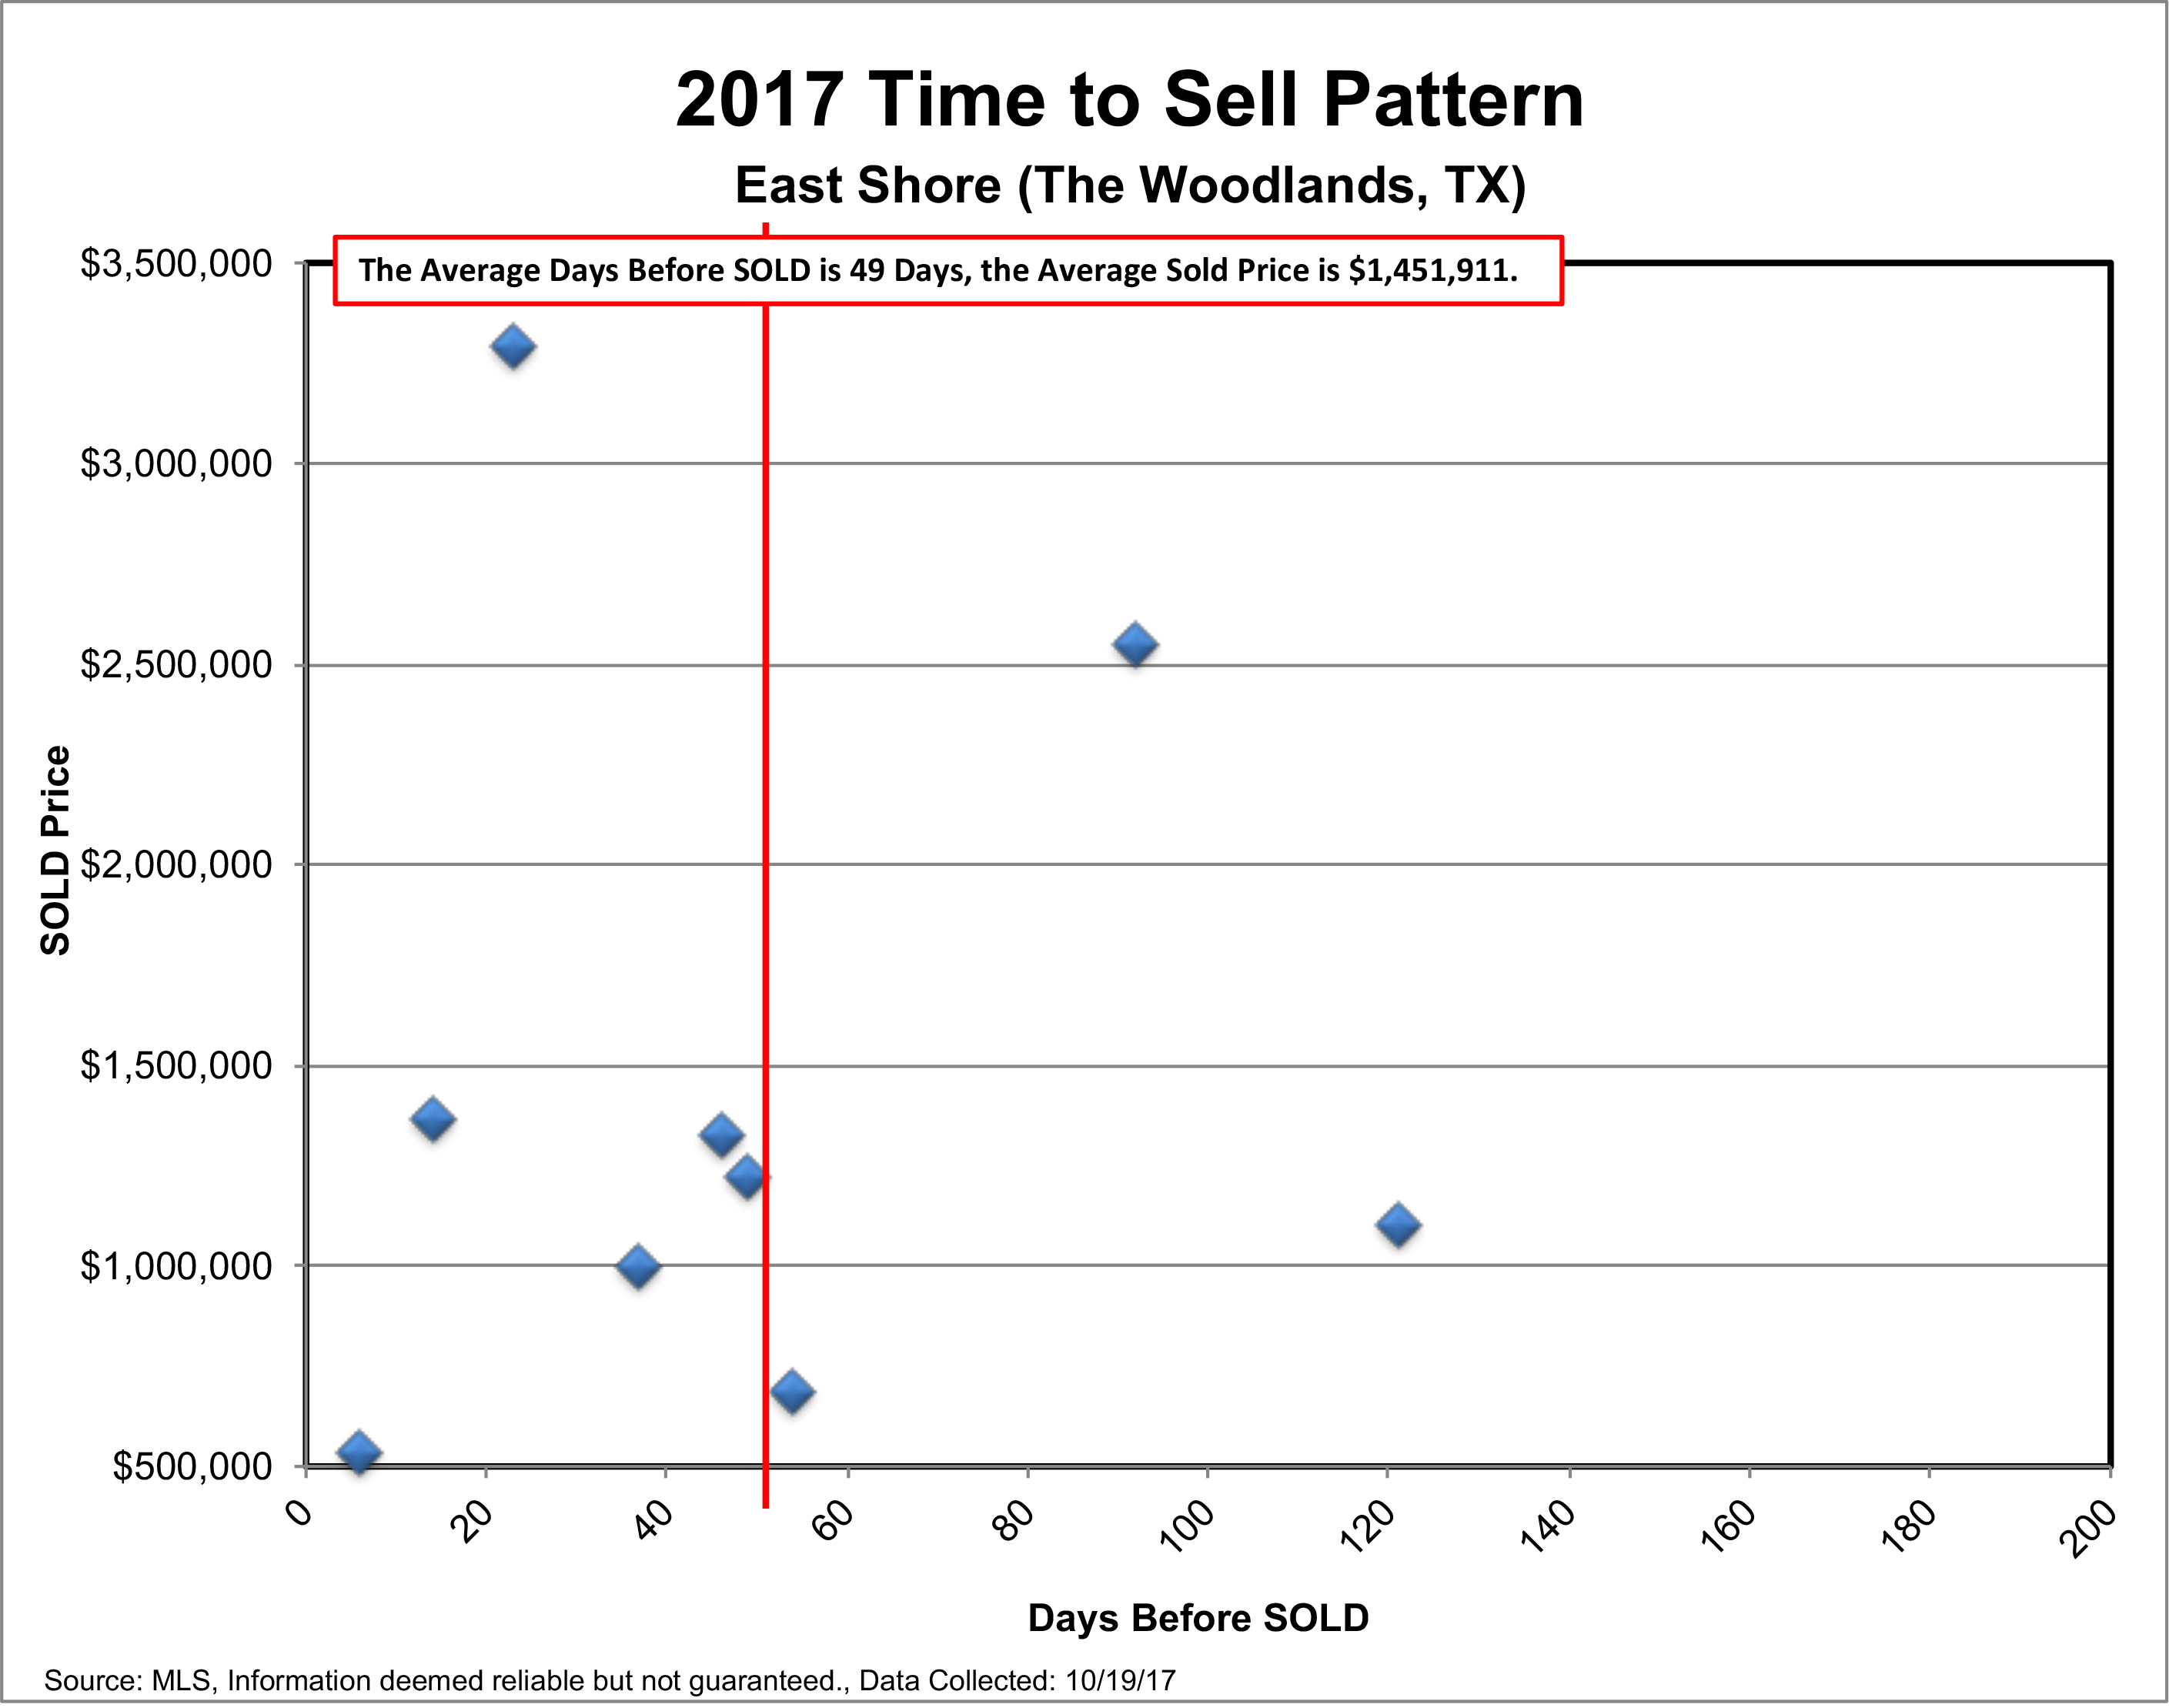 One really awesome thing to see, is that the average sold price in 2016 was $900,762 and the average sold price in 2017 is $1,451,911. What an awesome increase!
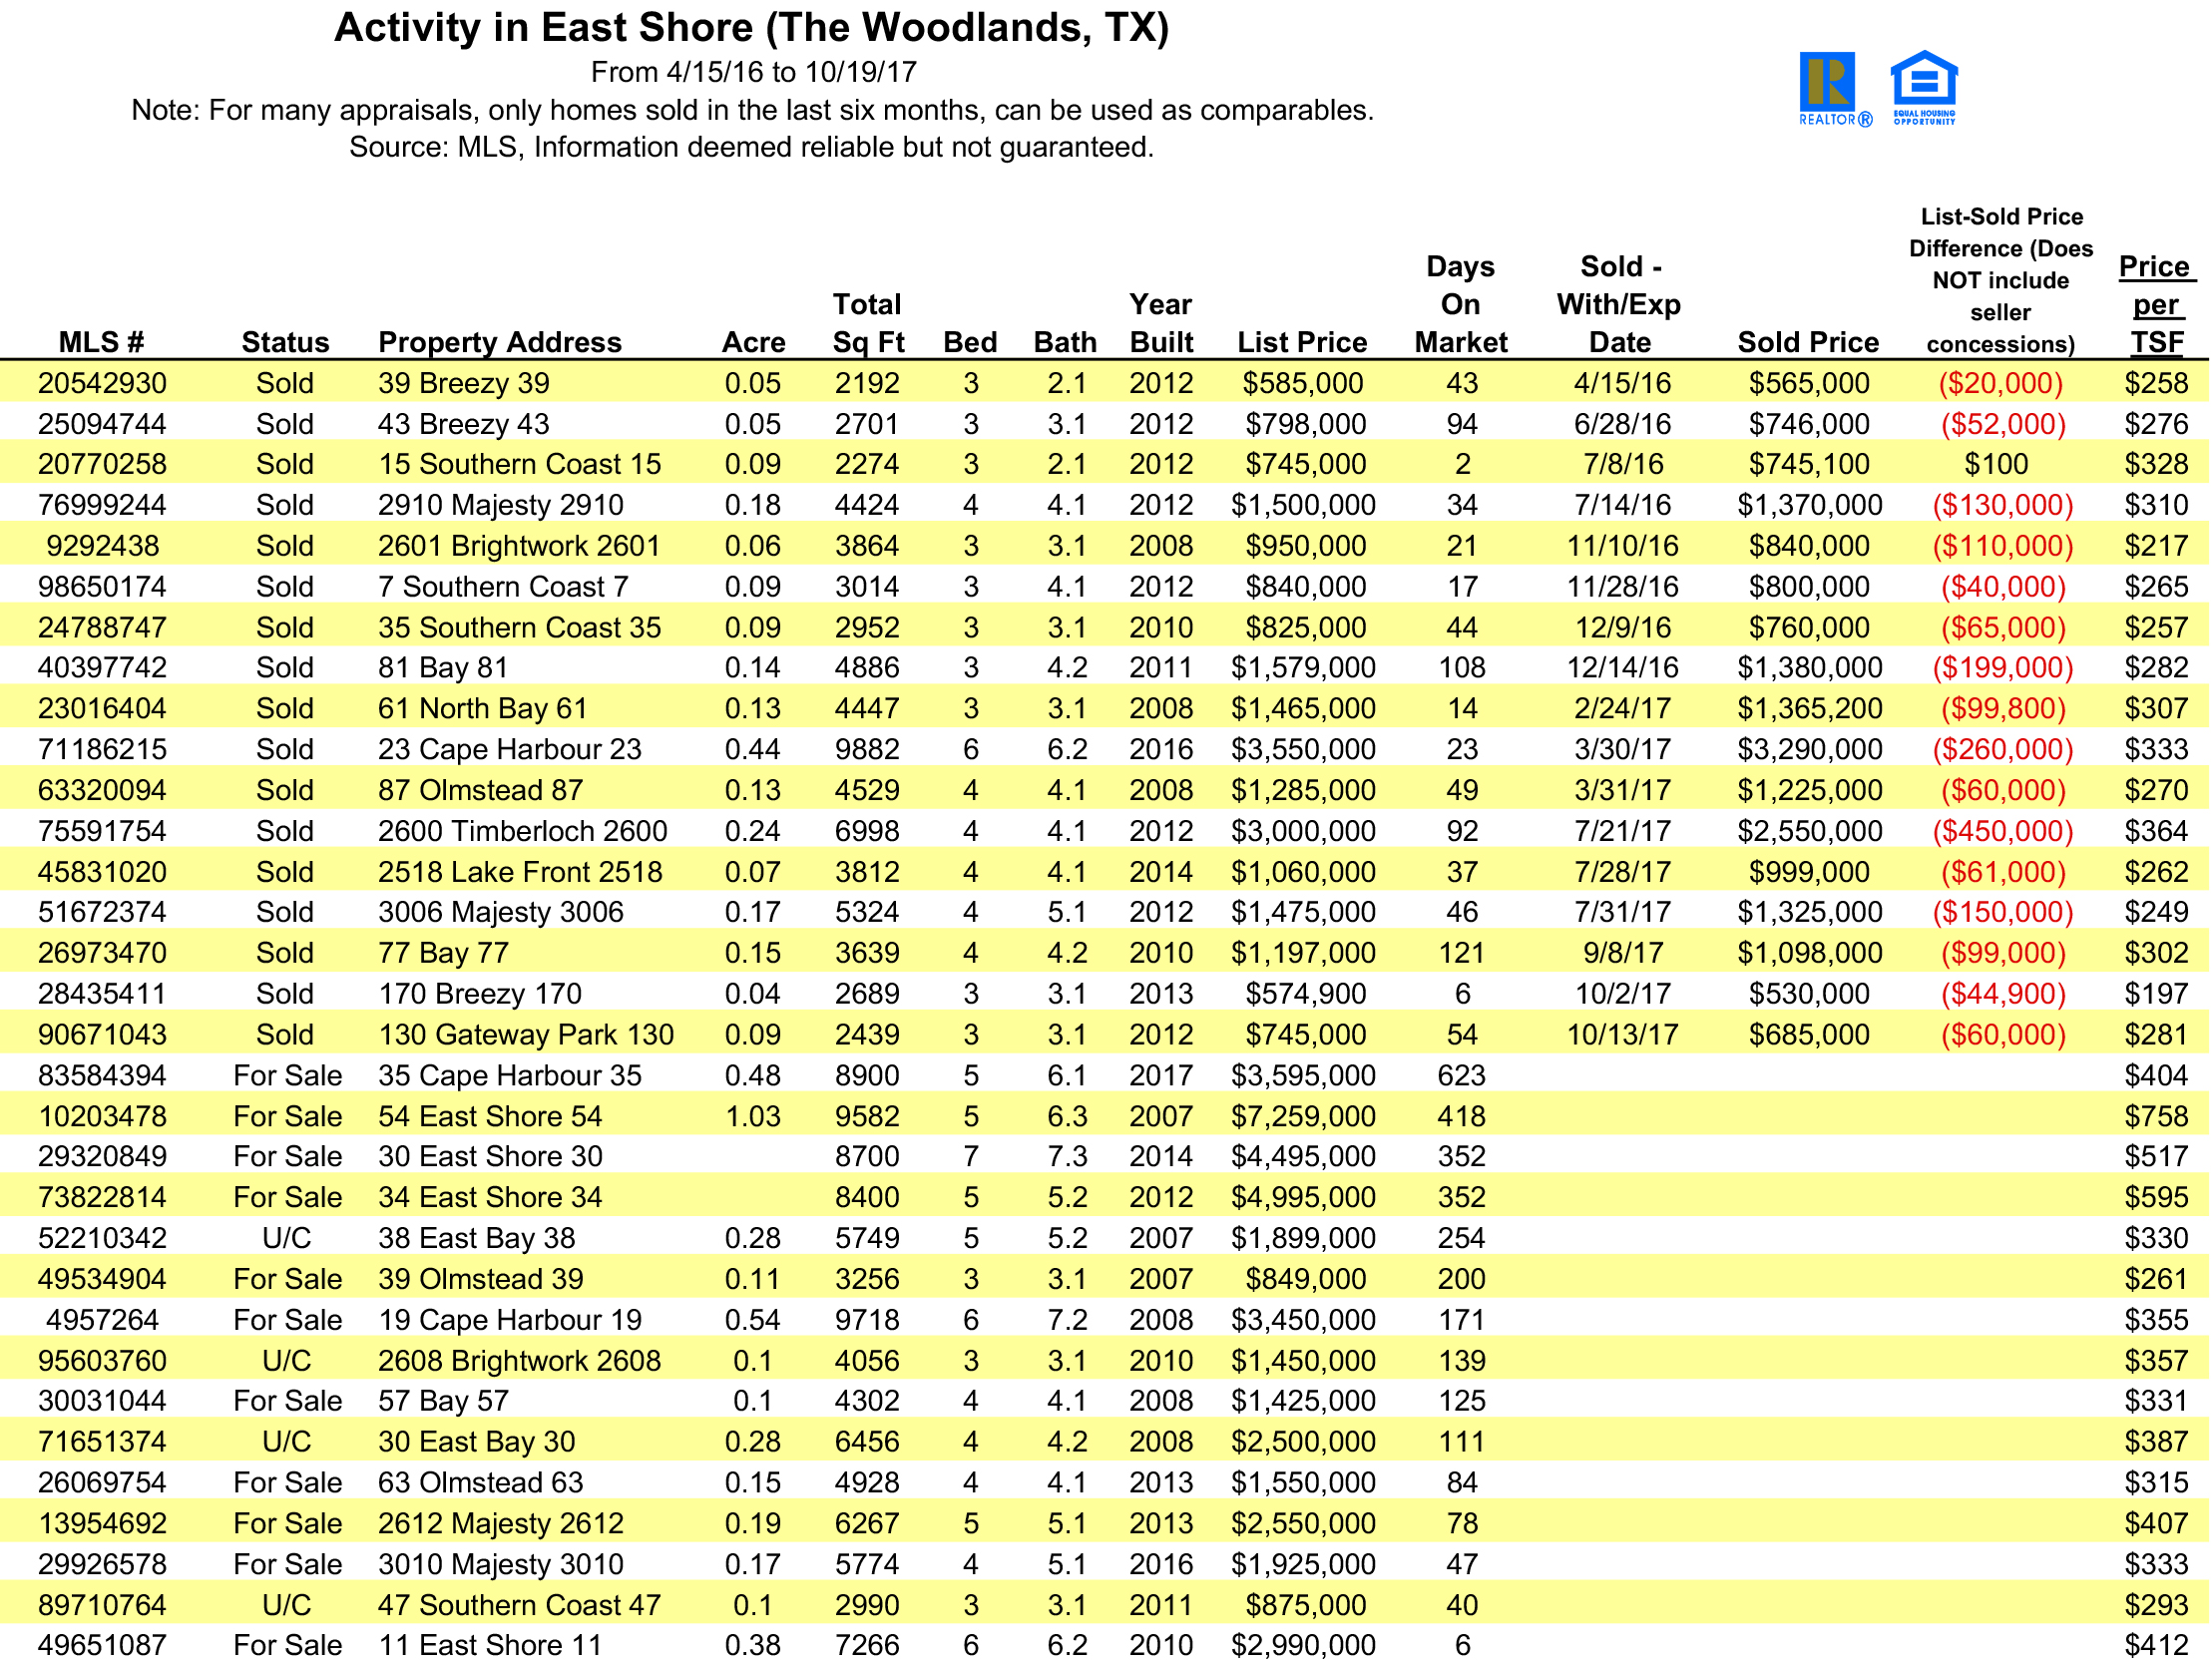
 Last, but not least, I decided to go ahead and post the spreadsheet of the last two years of sold data (with current inventory)..
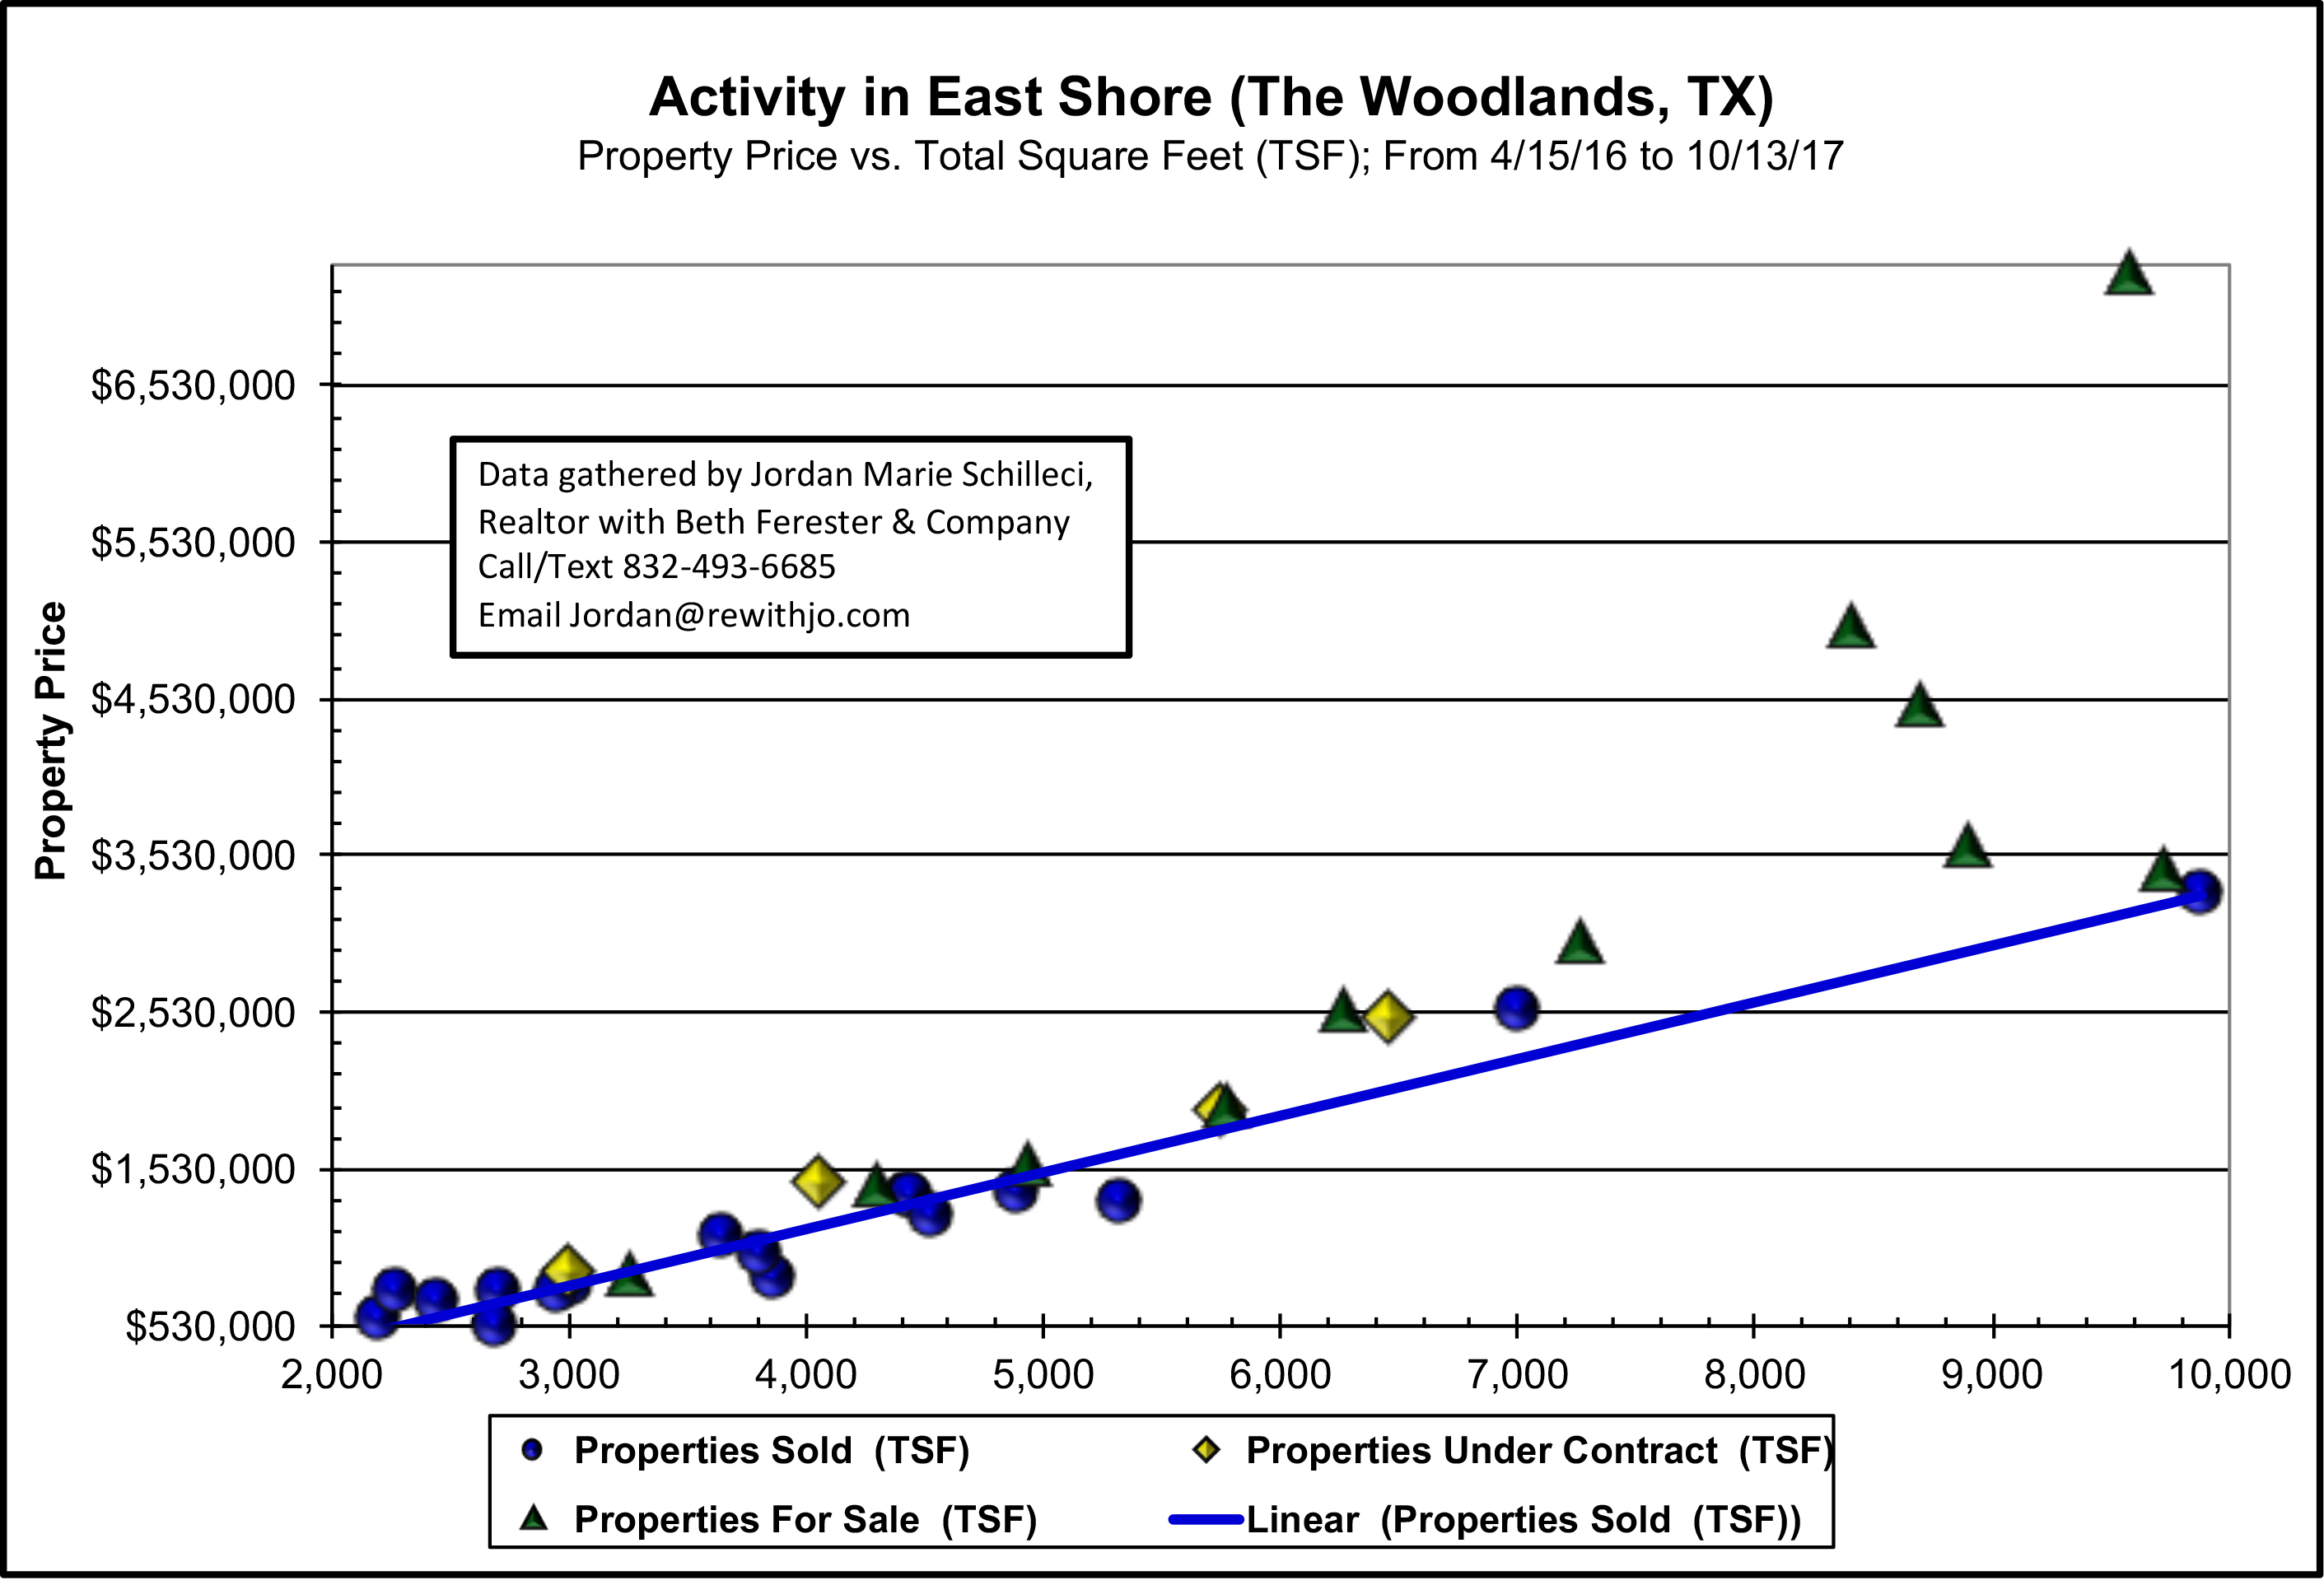
As you can probably assume, there are different levels of builders in East Shore, and different types of homes. There are town homes and row homes, and homes on oversized waterfront lots. East Shore really has a lot to offer in the $500k+ price range!
Some more pieces of interesting statistics:
- This past week, one home sold, compared to in 2016, 0 homes sold in the same week.
- Two homes have sold this month to date.
- One was sold for asking price (a 2689 sq foot townhome, $213.80 a square foot).
- The other was a gorgeous home built by Pelican Builder that sold for $685,000, which is $280.85 a square foot.
If you would like some more specific data, please reach out to me. Until next time.. 🙂
Your Realtor,
Jordan Marie Schilleci, REALTOR®
Beth Ferester & Company
Call/Text 832-493-6685
Email Jordan@rewithjo.com

