For last week’s market update on The Woodlands, feel free to follow this link.
There are currently 770 active homes on the market, 42 option pending (just went under contract), and 160 pending (weeks or days away from closing), all these numbers are up from last week’s report.
Since not much time has passed since last week’s, I have decided to do something different for this week’s market analysis. I want to compare the number of home sold over the past 12 years.
In 2016, 1931 homes sold.
In 2015, 2027 homes sold.
In 2014, 2204 homes sold.
In 2013, 2445 homes sold.
In 2012, 2242 homes sold.
In 2011, 1963 homes sold.
In 2010, 1685 homes sold.
In 2009, 1669 homes sold.
In 2008, 1757 homes sold.
In 2007, 2238 homes sold.
In 2006, 2407 homes sold.
In 2005, 2323 homes sold.
I just love numbers, and while I have my own thoughts and opinions when looking at the last 12 years of data, I will leave you to form your own. 🙂
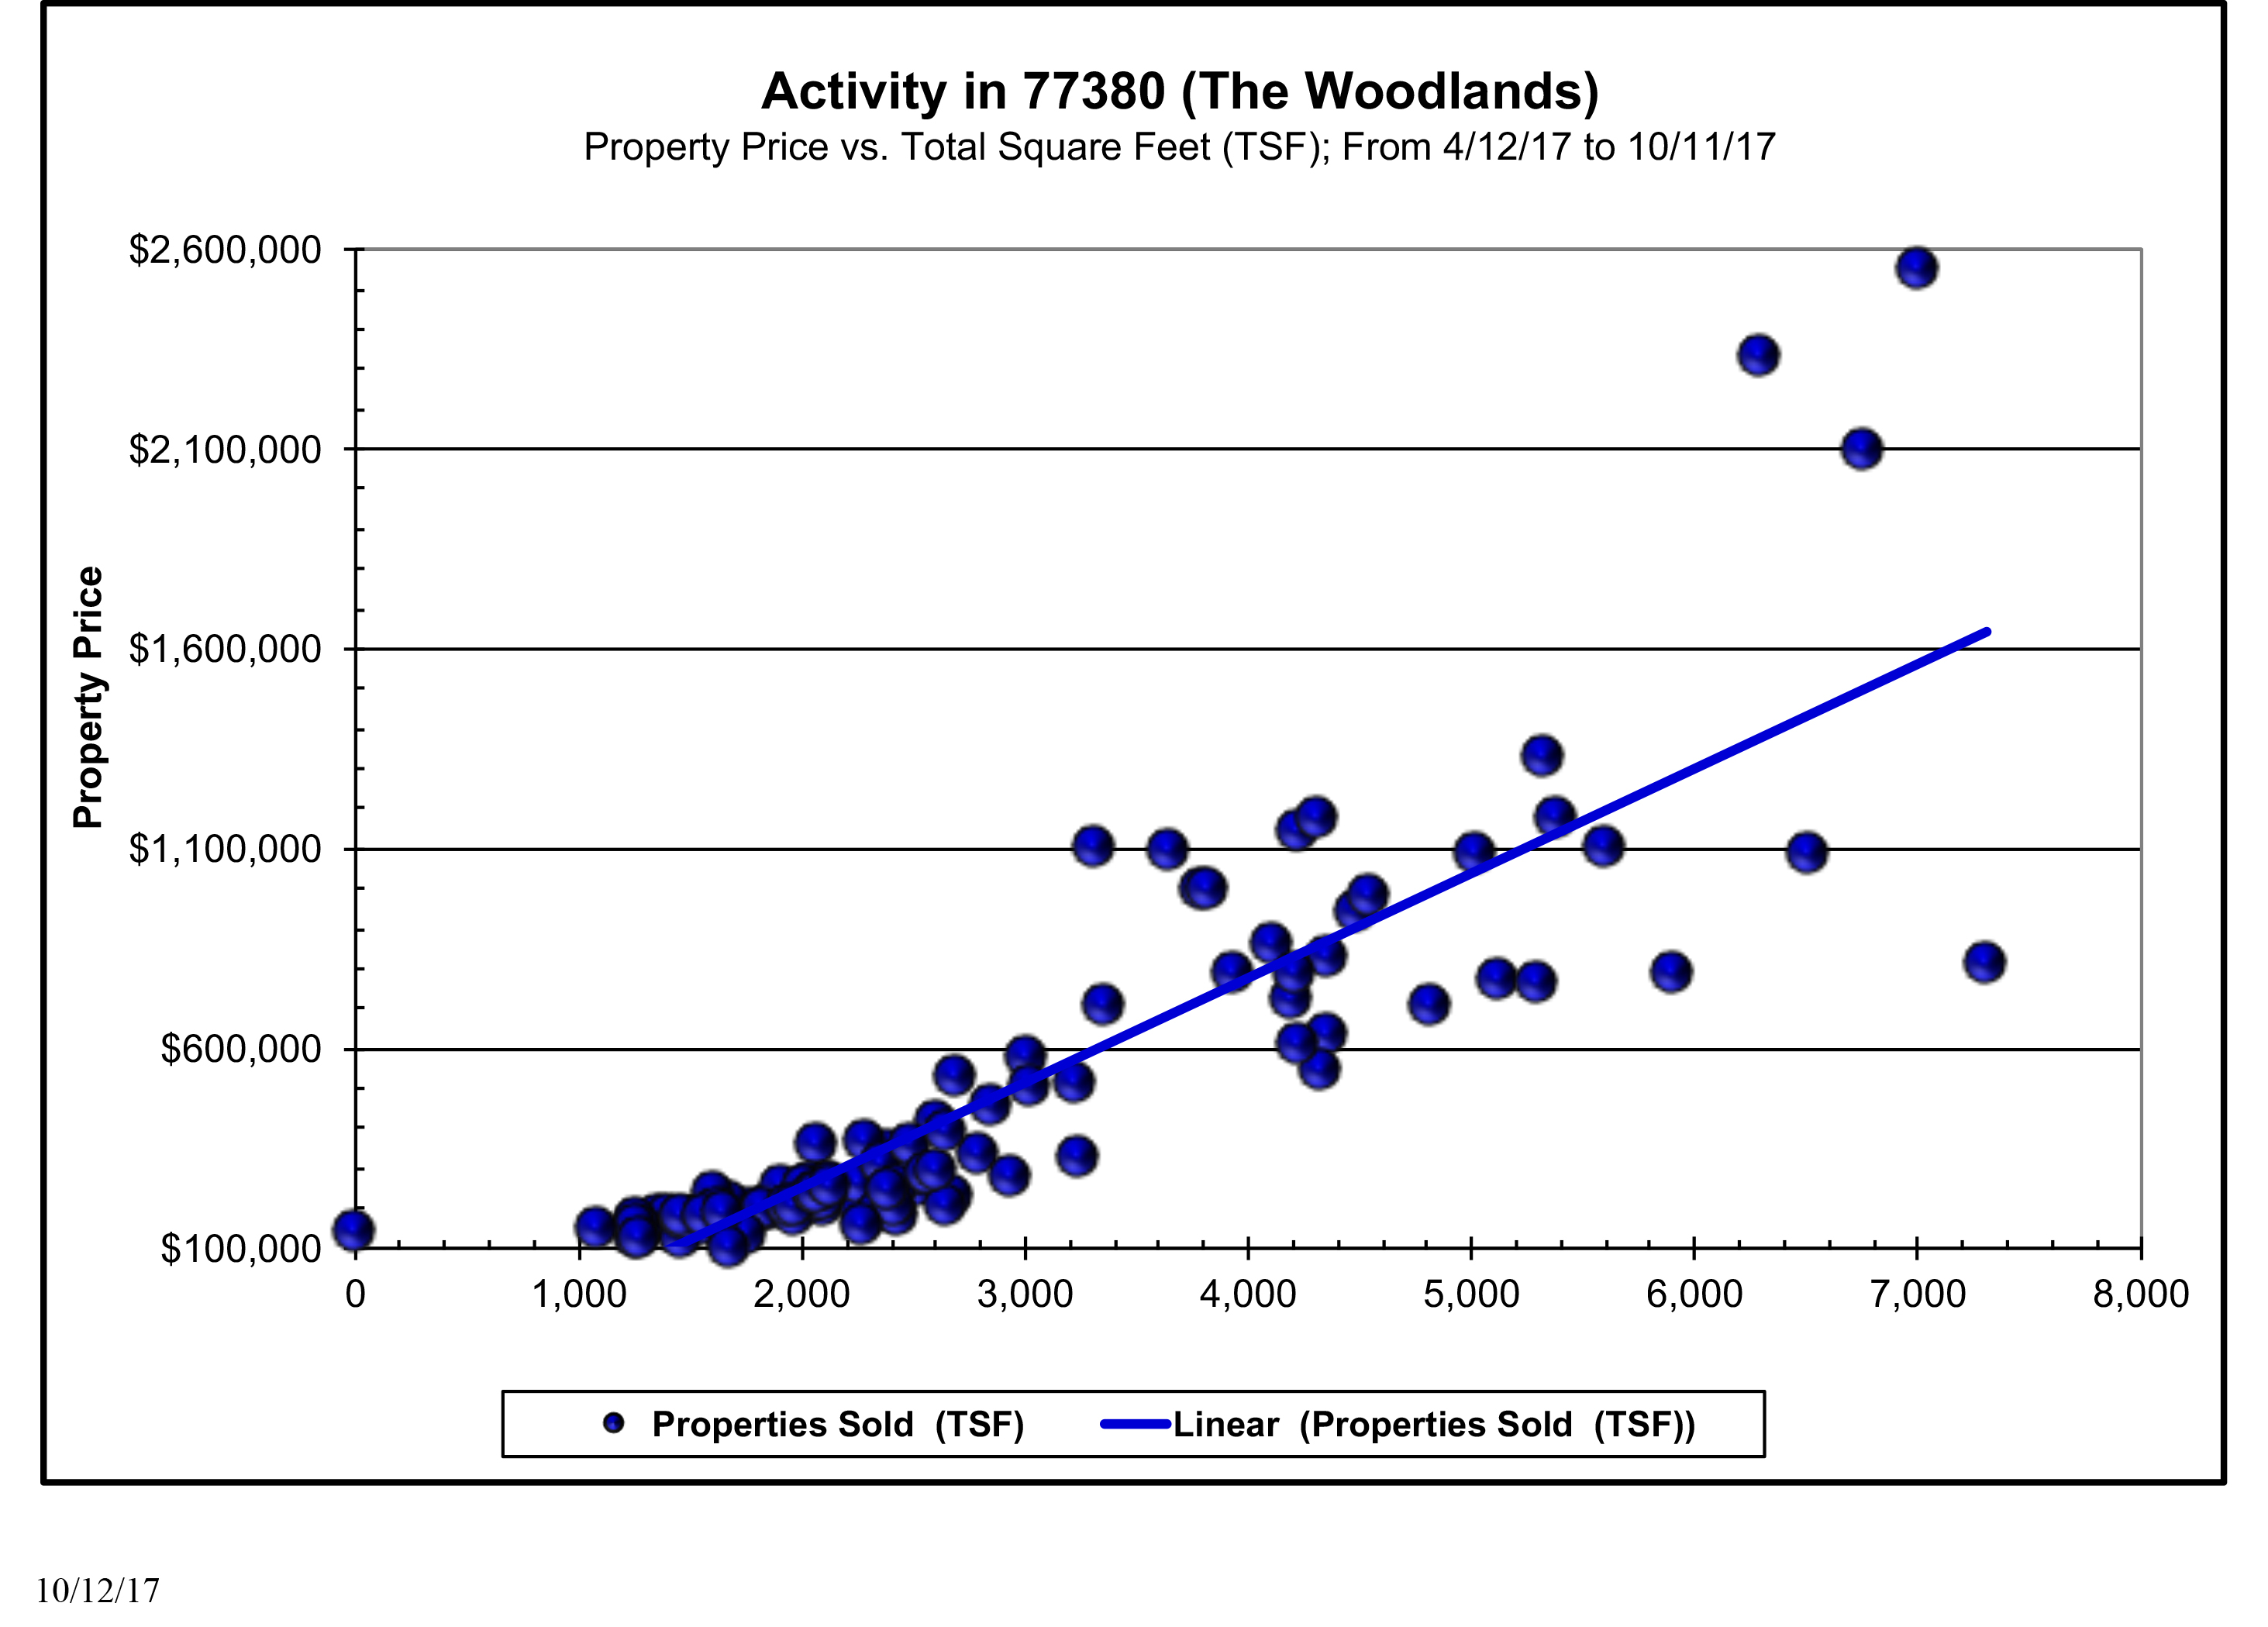
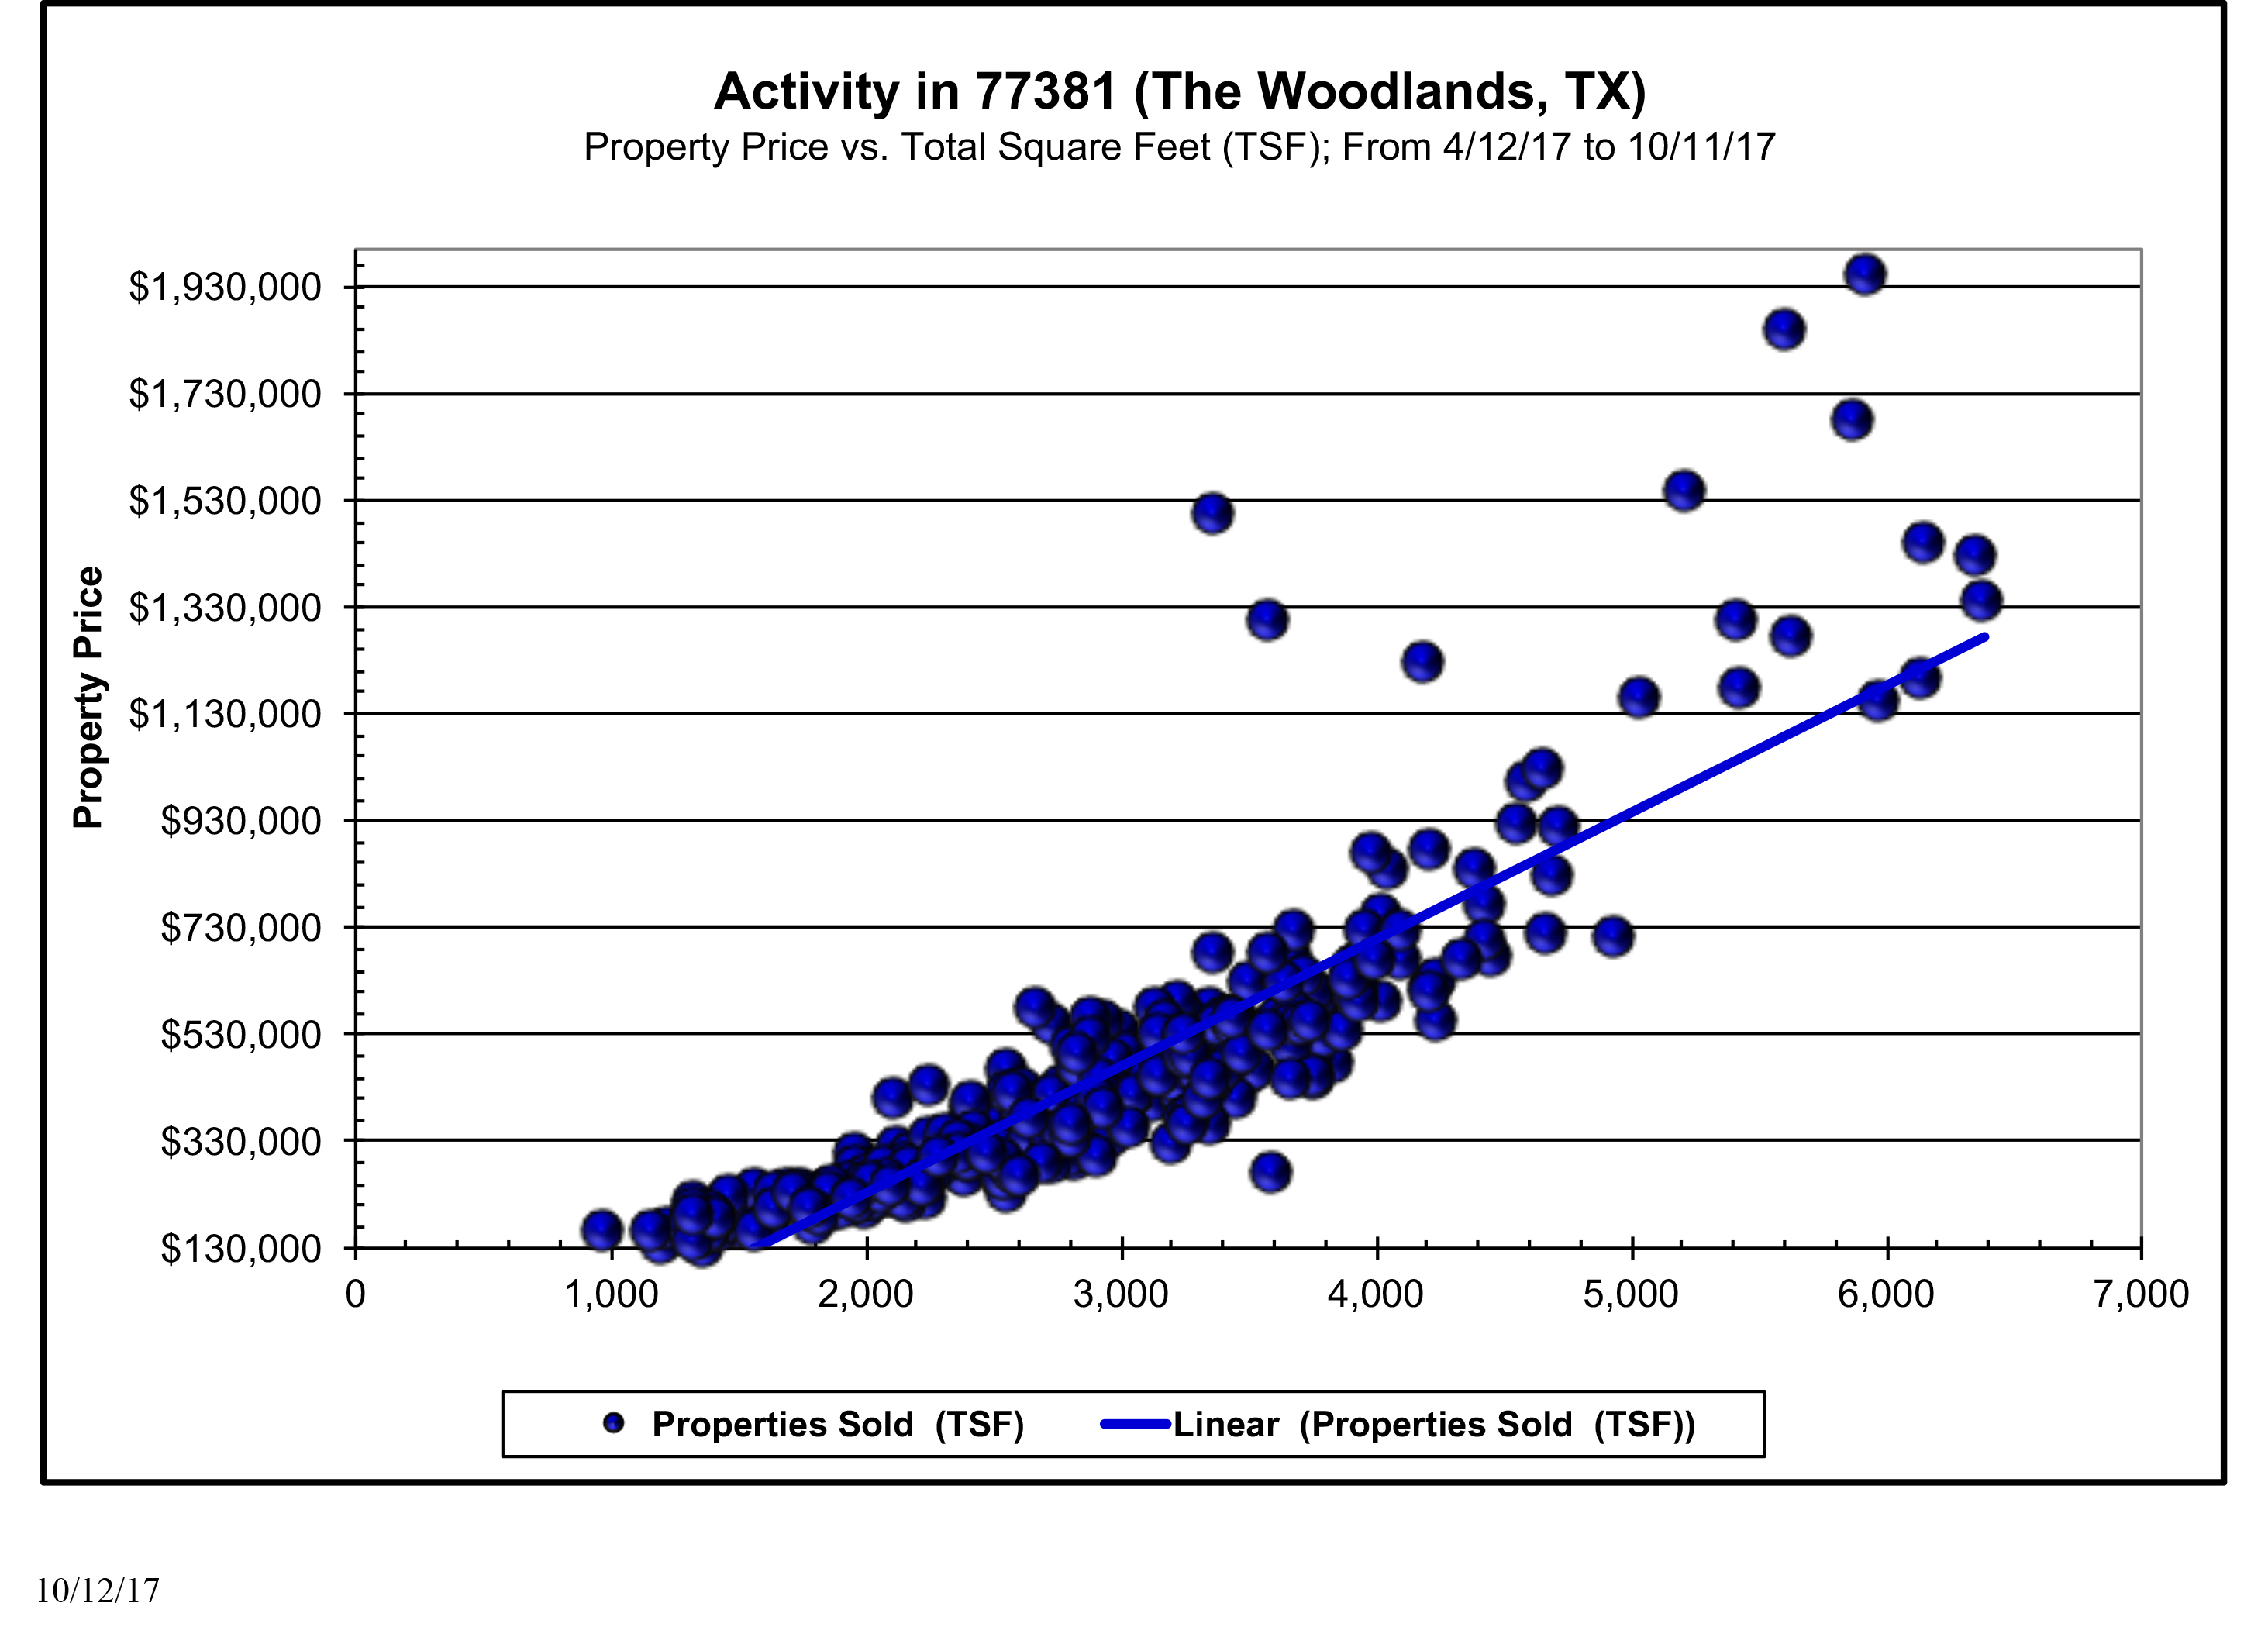
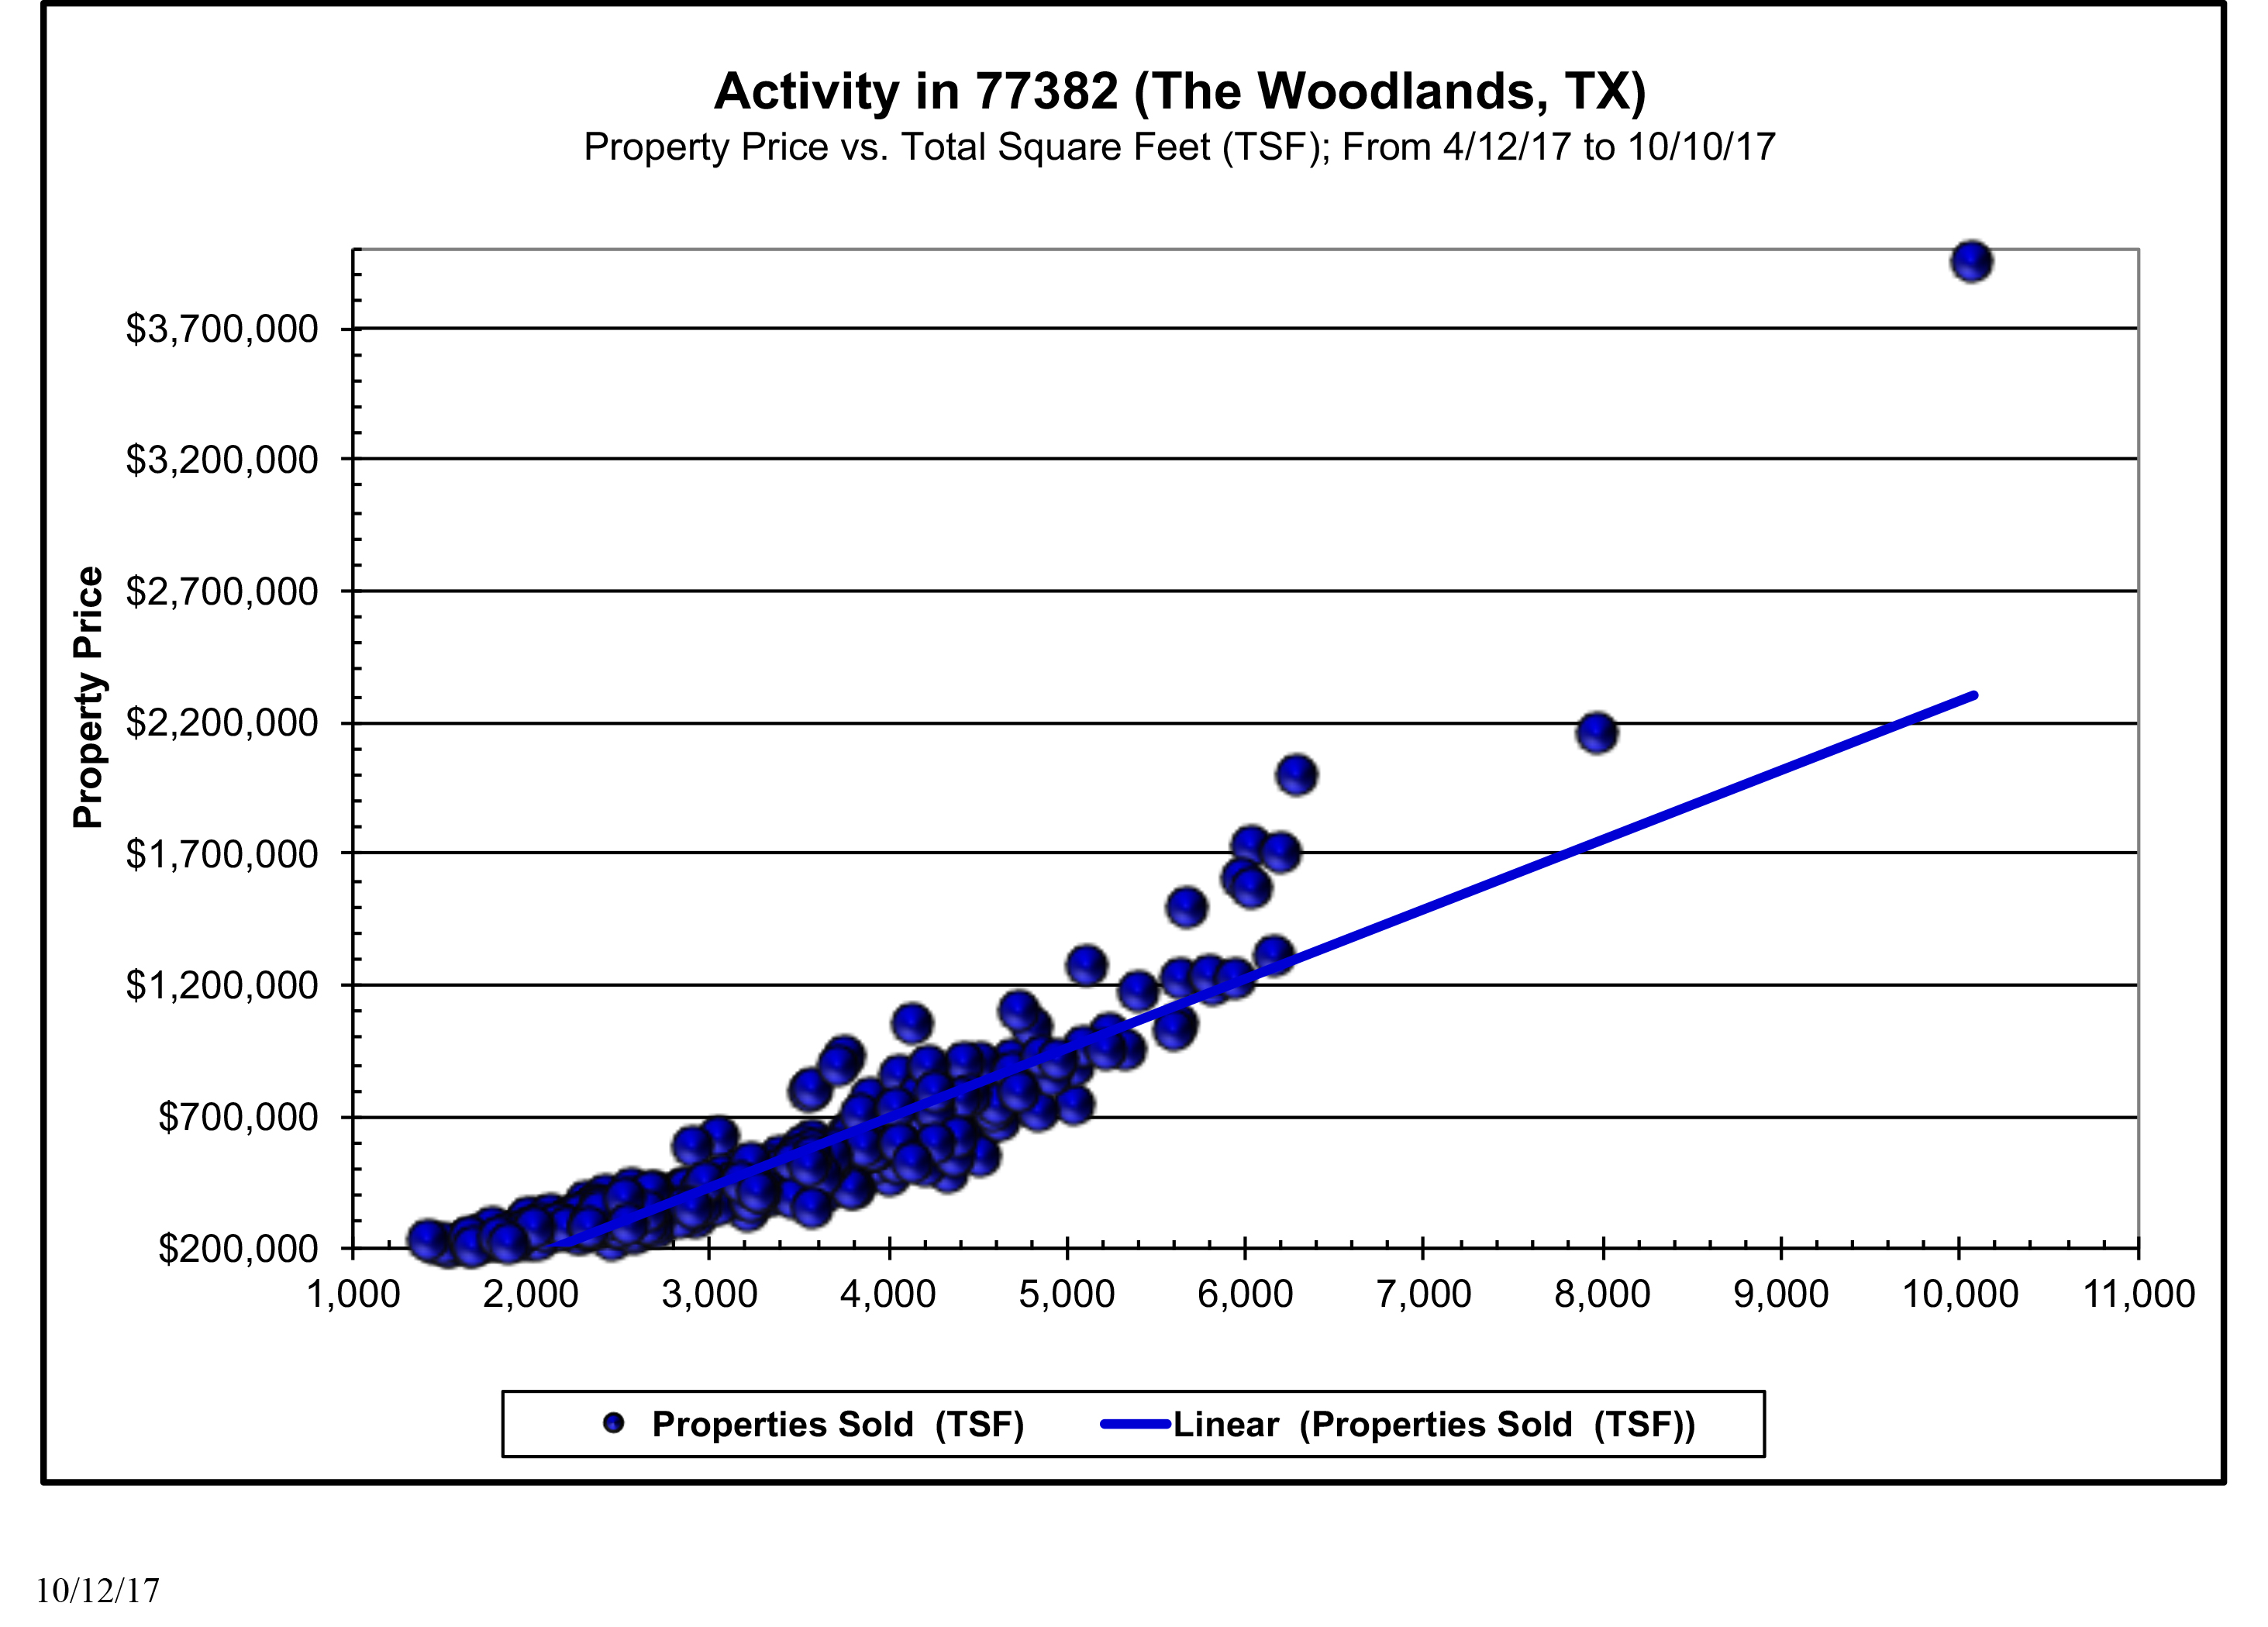
Since we all know how much I love scattergrams, I am going to include some with the last six months of sales for a few different areas of The Woodlands..
77380

77381

77382

If you would like some more specific data, please reach out to me. 🙂
Your Realtor,
Jordan Marie Schilleci, REALTOR®
Beth Ferester & Company
Call/Text 832-493-6685

