Hi, and welcome to today’s market update. I have been using Saturdays to run the data on a Klein ISD neighborhood, and today I have chosen Gleannloch Farms. Back in the day, I use to nanny and babysit in Gleannloch Farms, and while it has grown so much since then, it still remains one of my favorite neighborhoods, since my dad’s restaurant was originally across the street, and we grew to know so many of the residents.
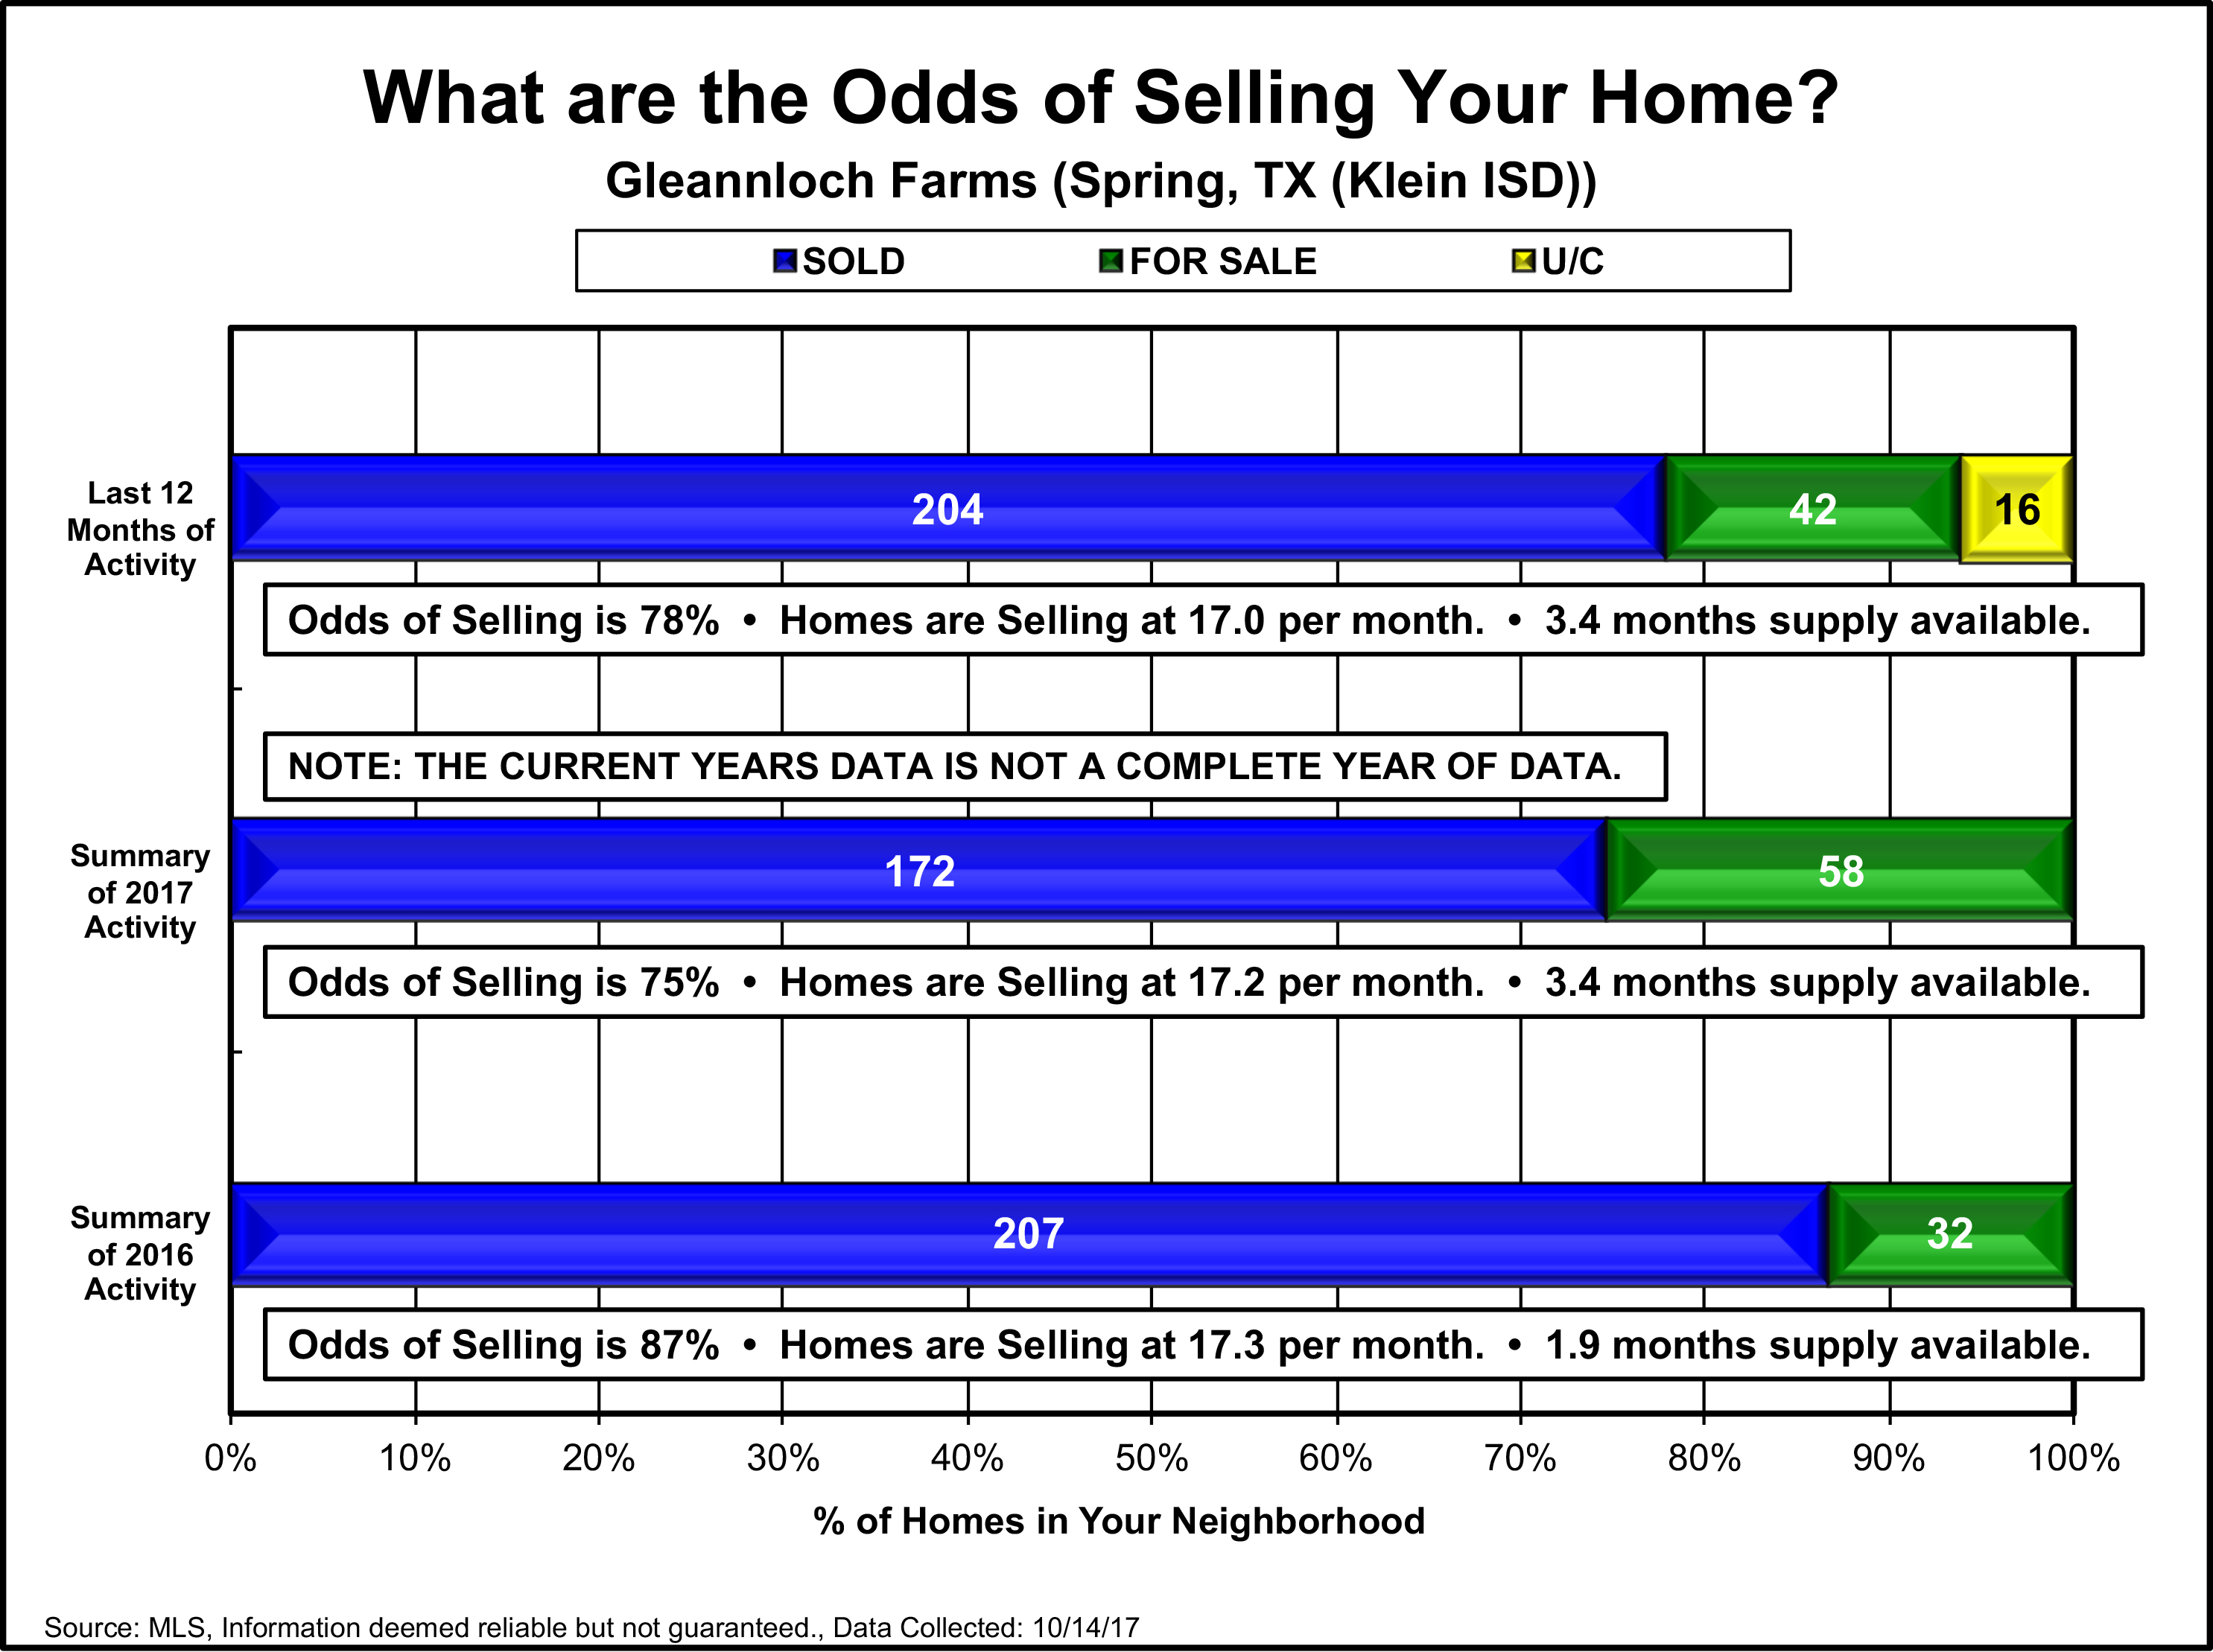
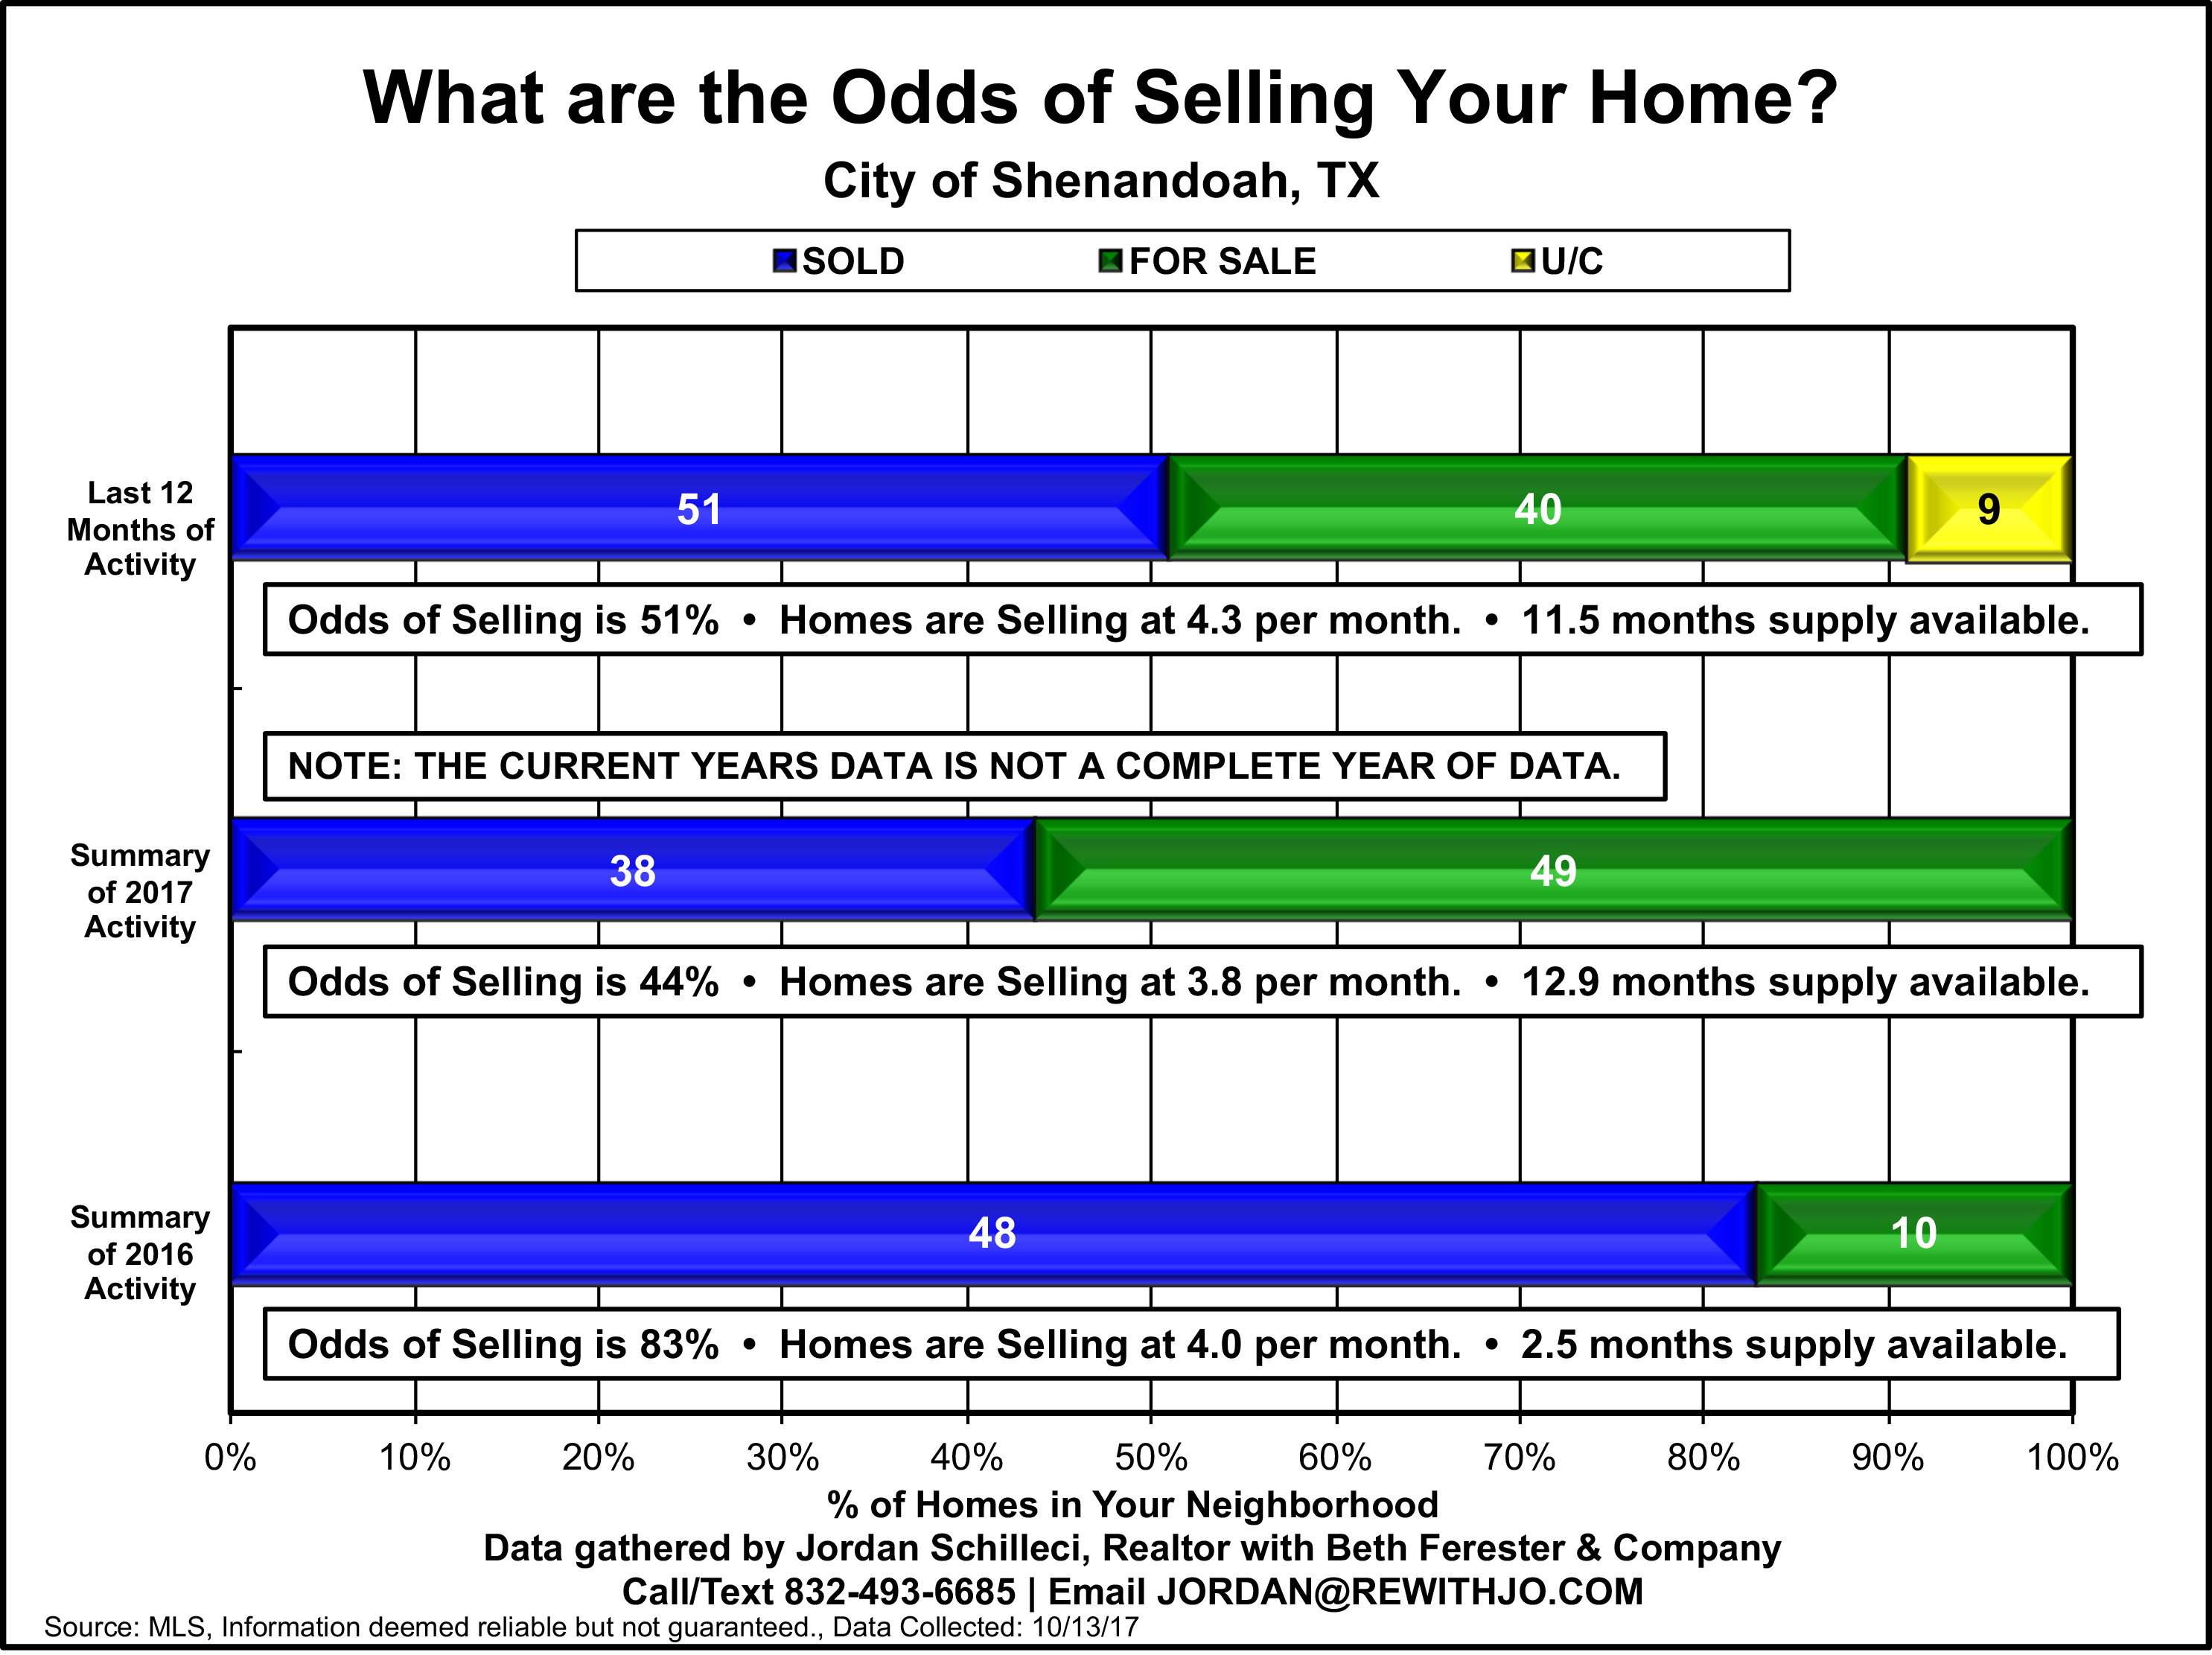
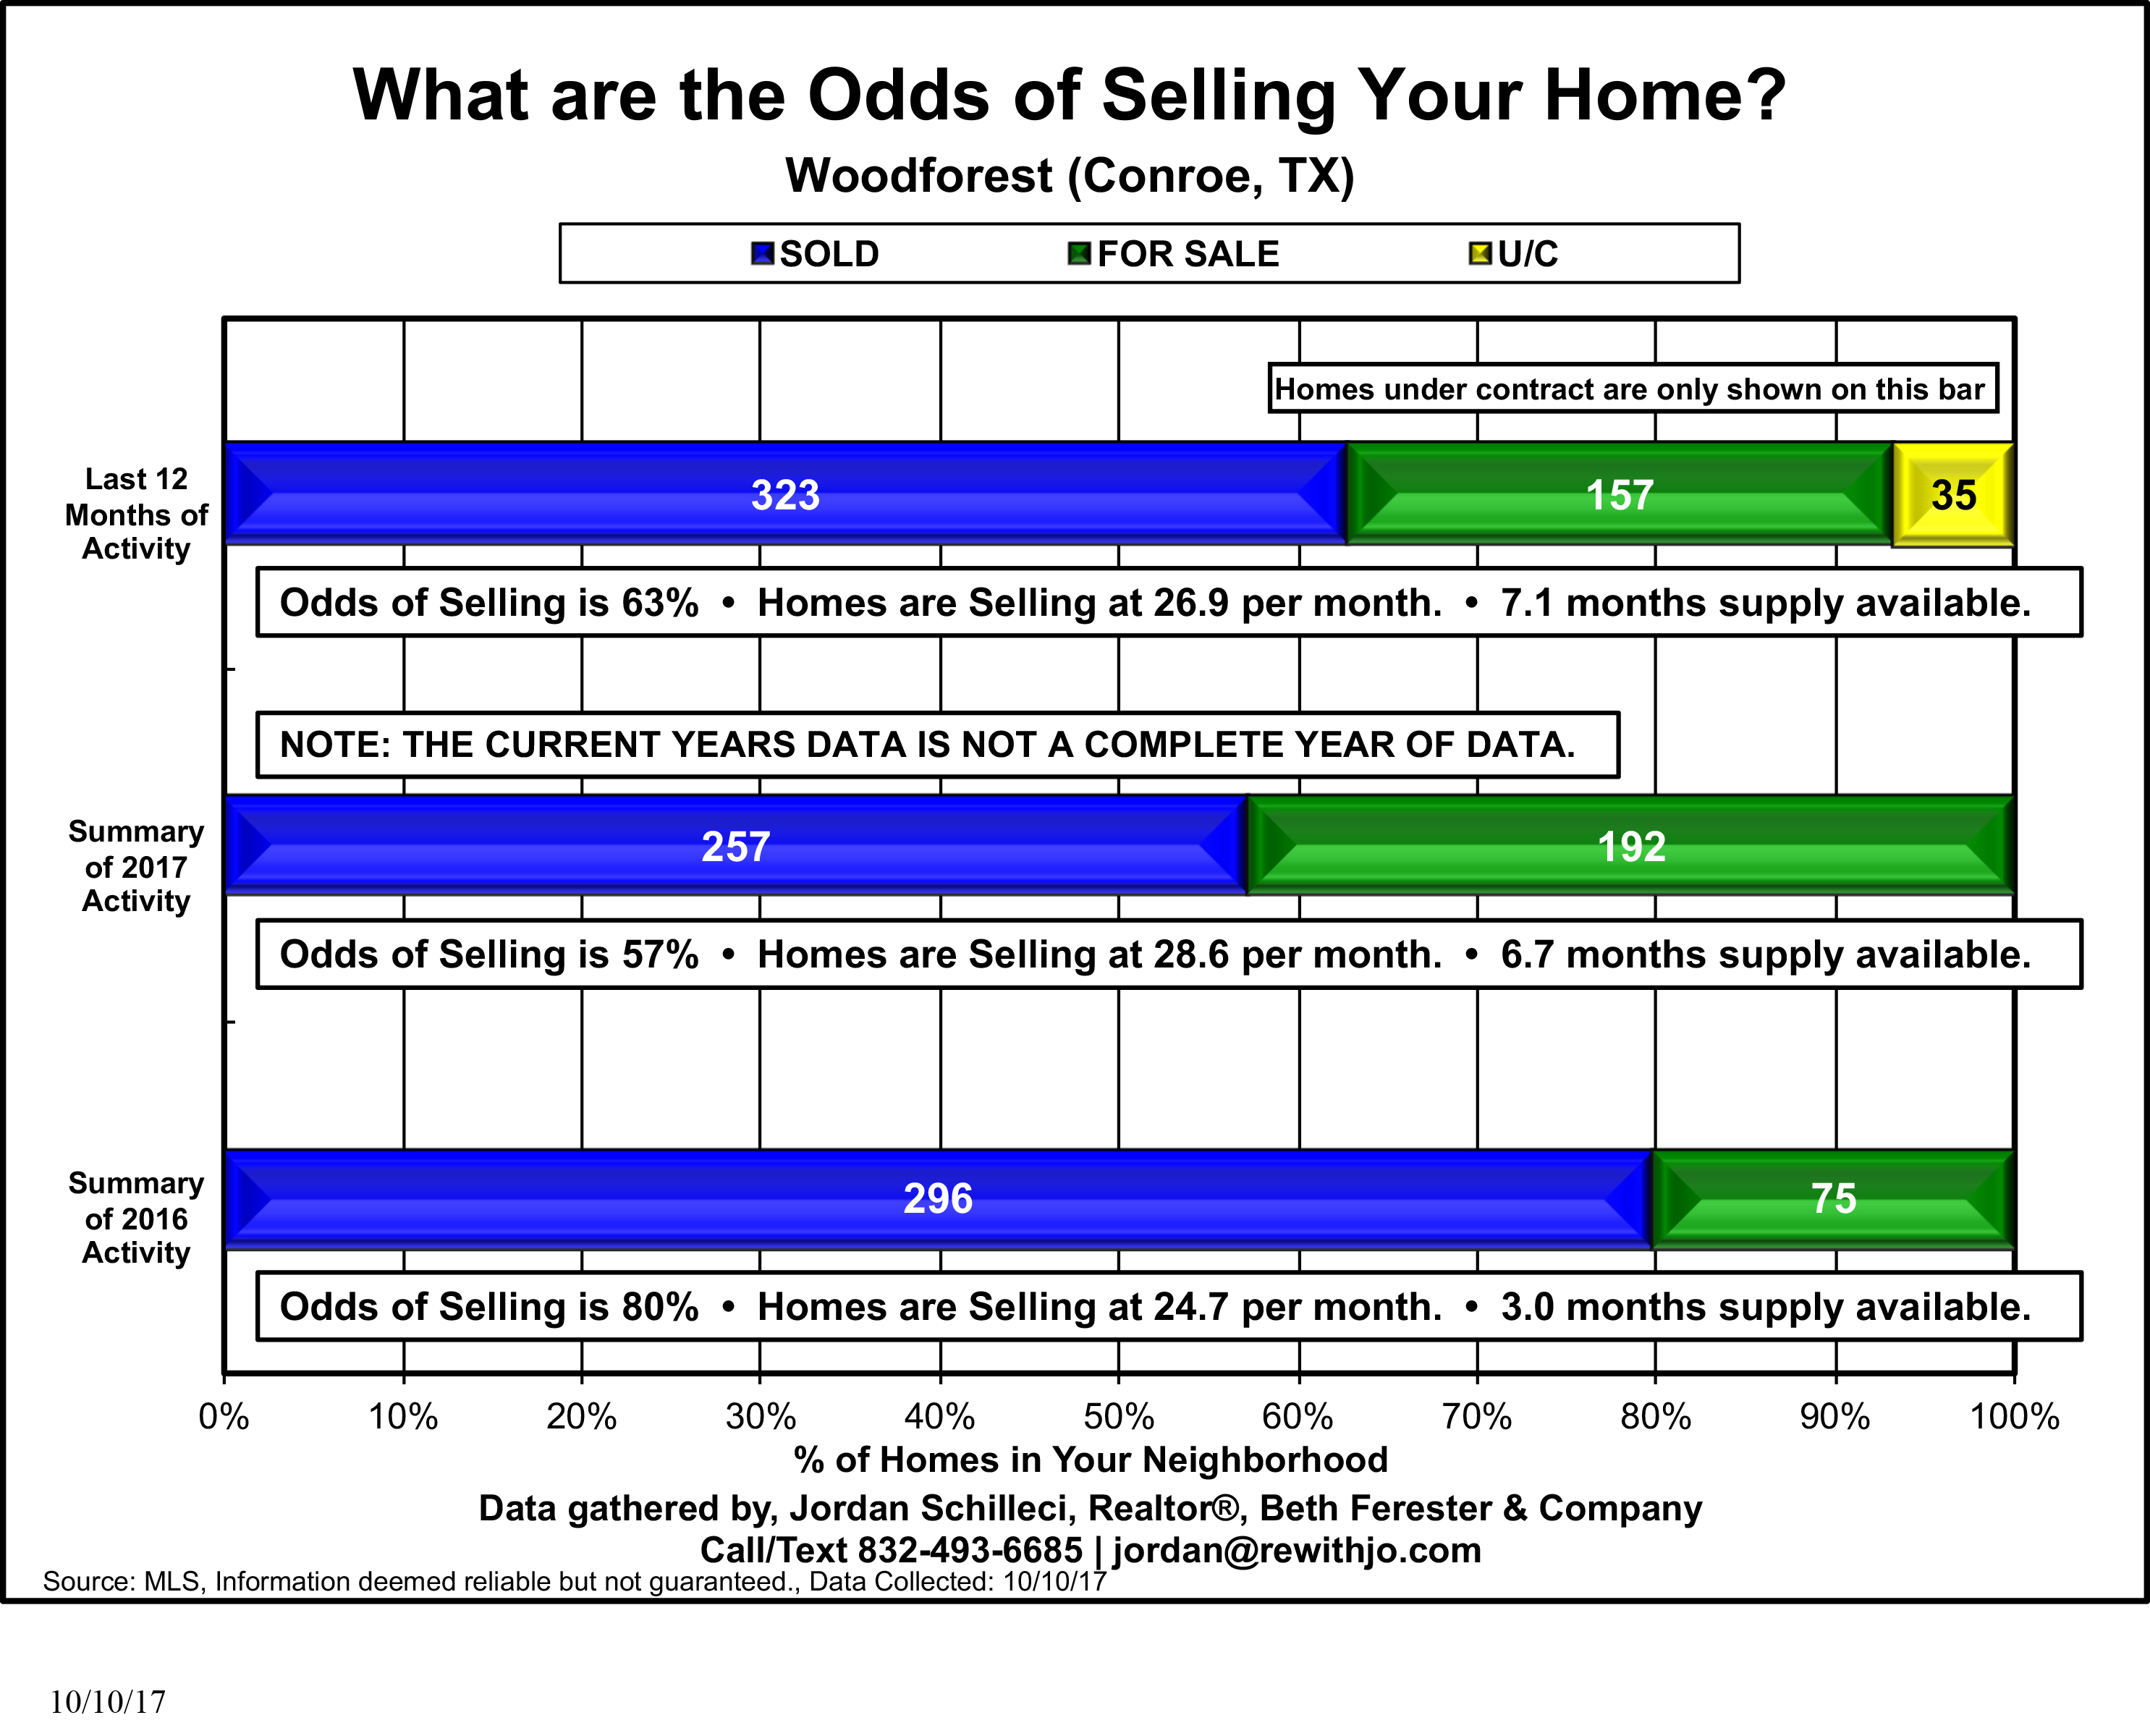
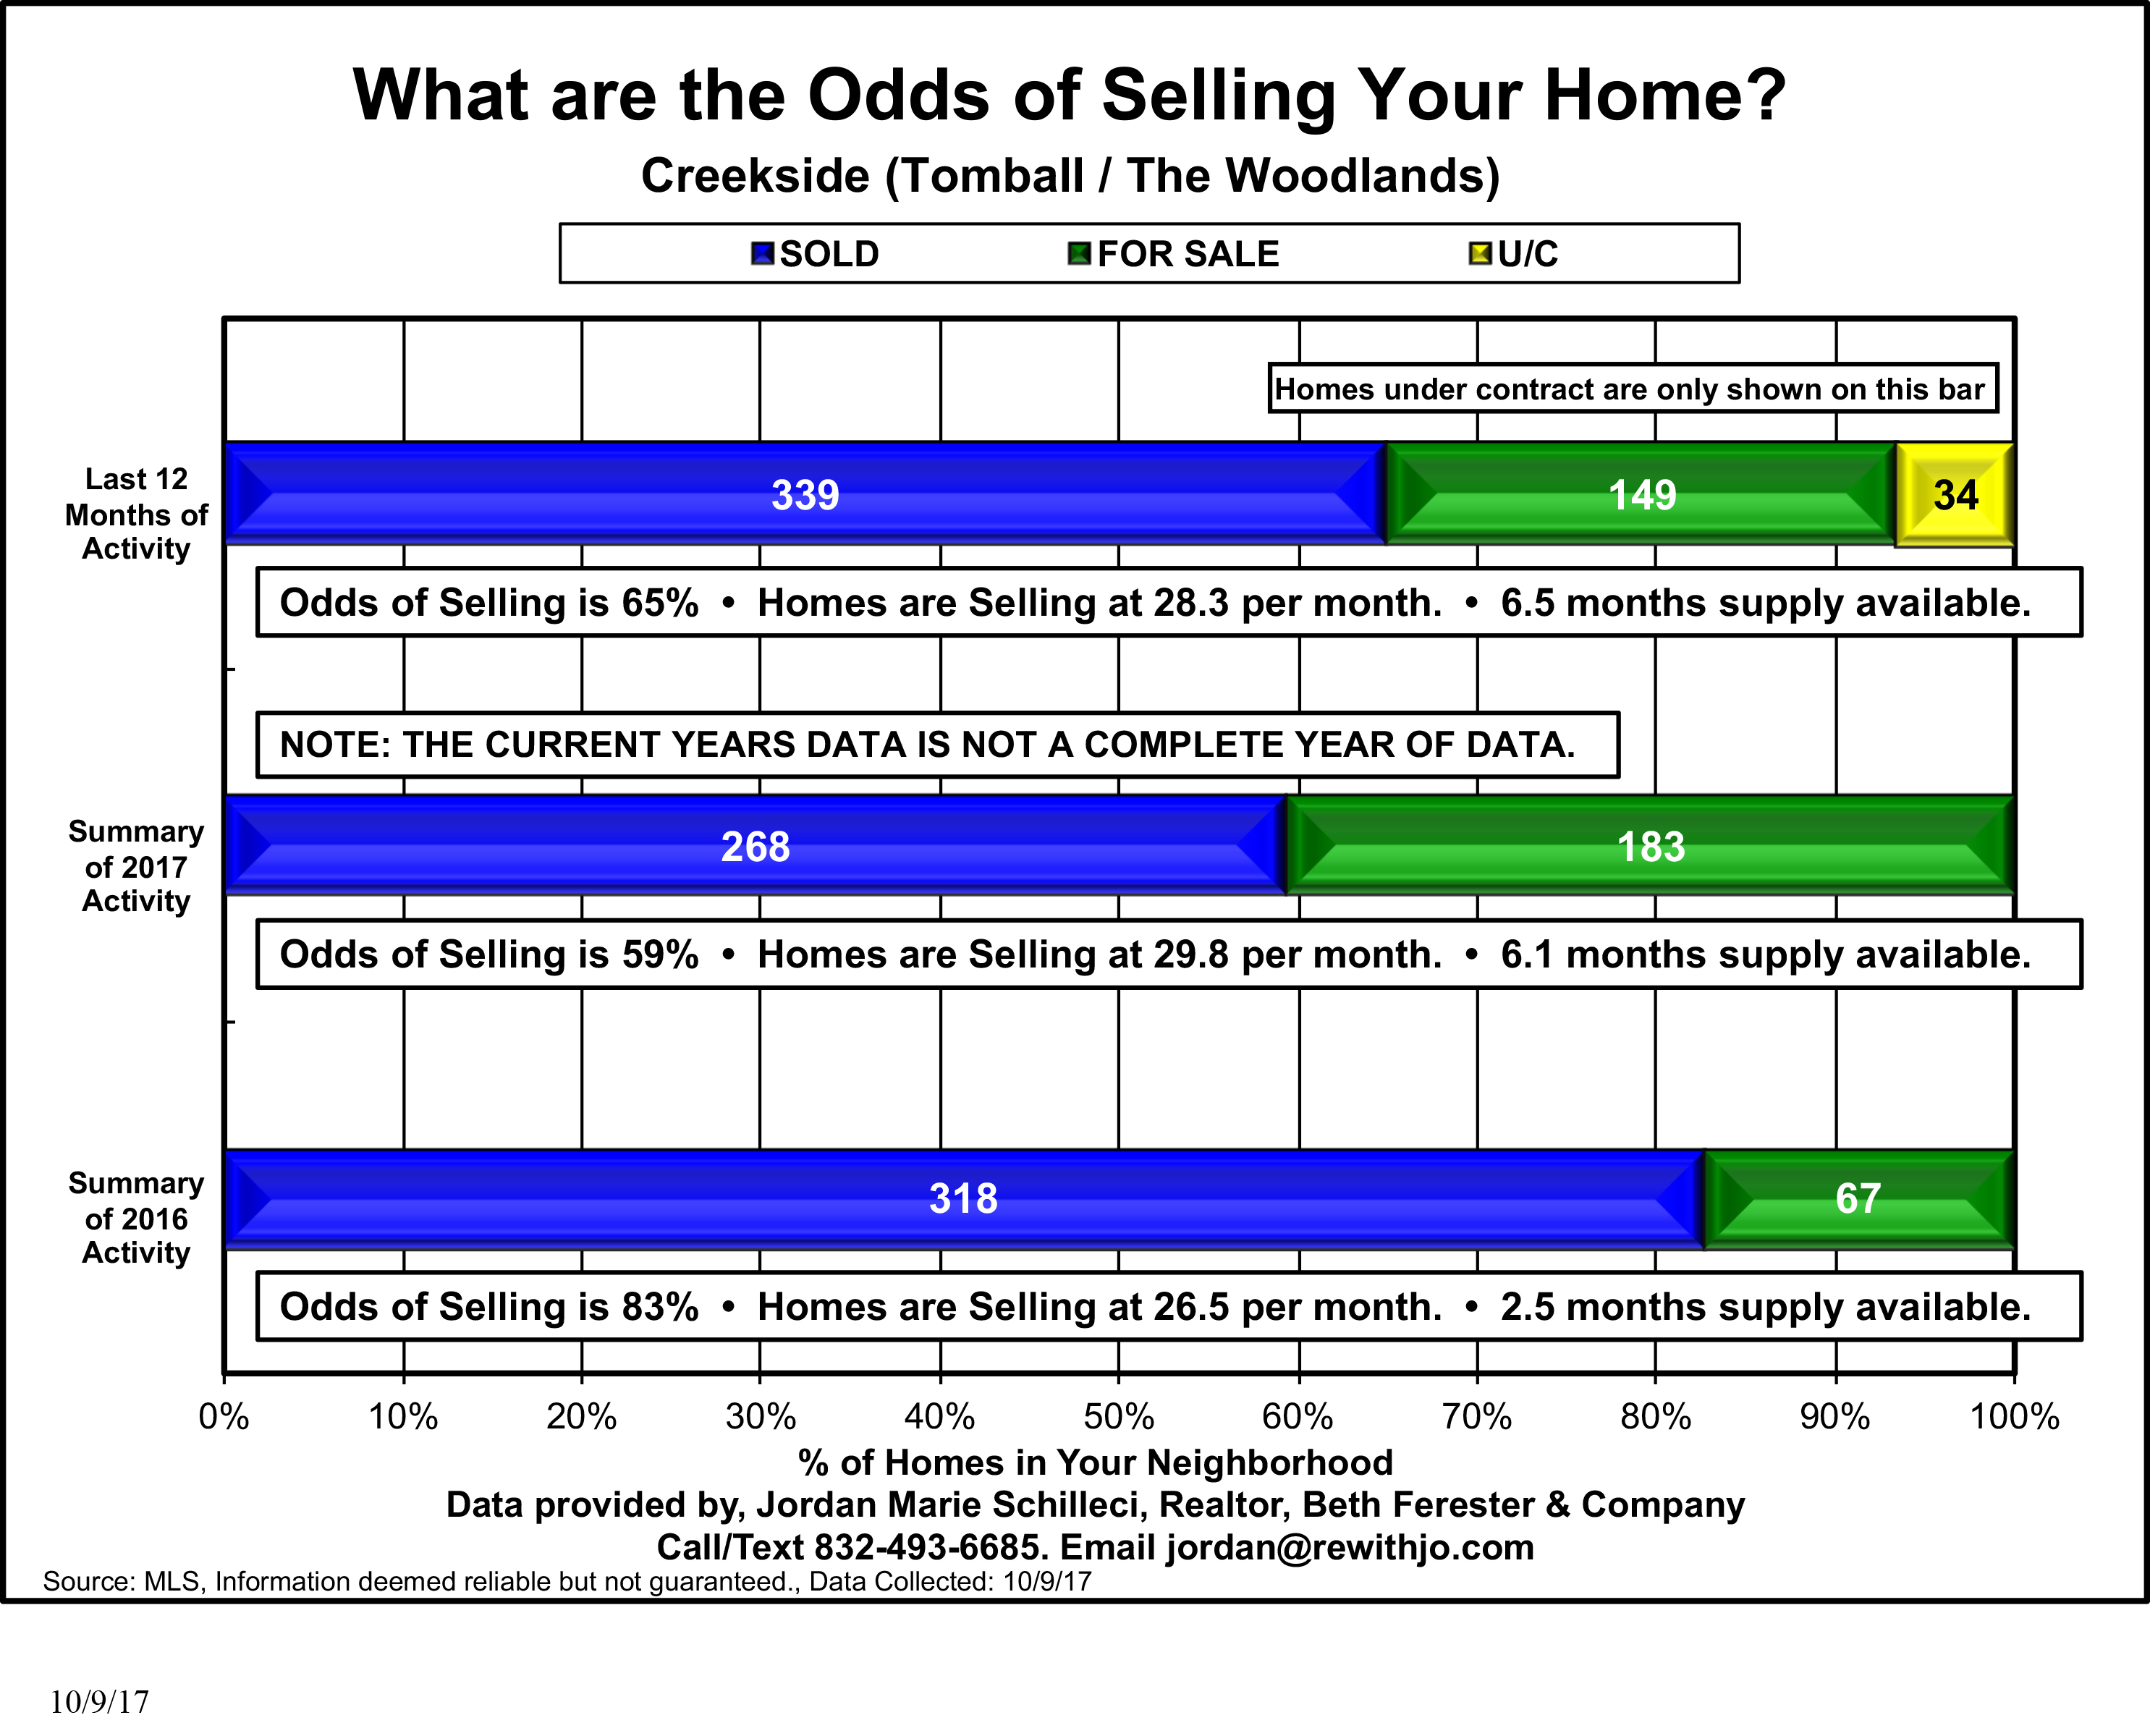
This graph is always referred to as your odds of selling. By looking at it, we learn that in the past 12 months, 204 homes have sold, 42 are currently on the market, and 16 are pending (and will probably close this year). When comparing 2017 and and 2016, we are behind a little bit on the year-to-date. I am going to assume we won’t sell 207 homes this year, like we did in 2016.
But when you compare just September and August of this year to last year.. In 2016, 56 homes sold in September and 64 homes sold in August. In 2017, 68 homes sold in September and 57 homes sold in August. If you add up the corresponding numbers, this year we have sole 5 more homes within those two months than last year.
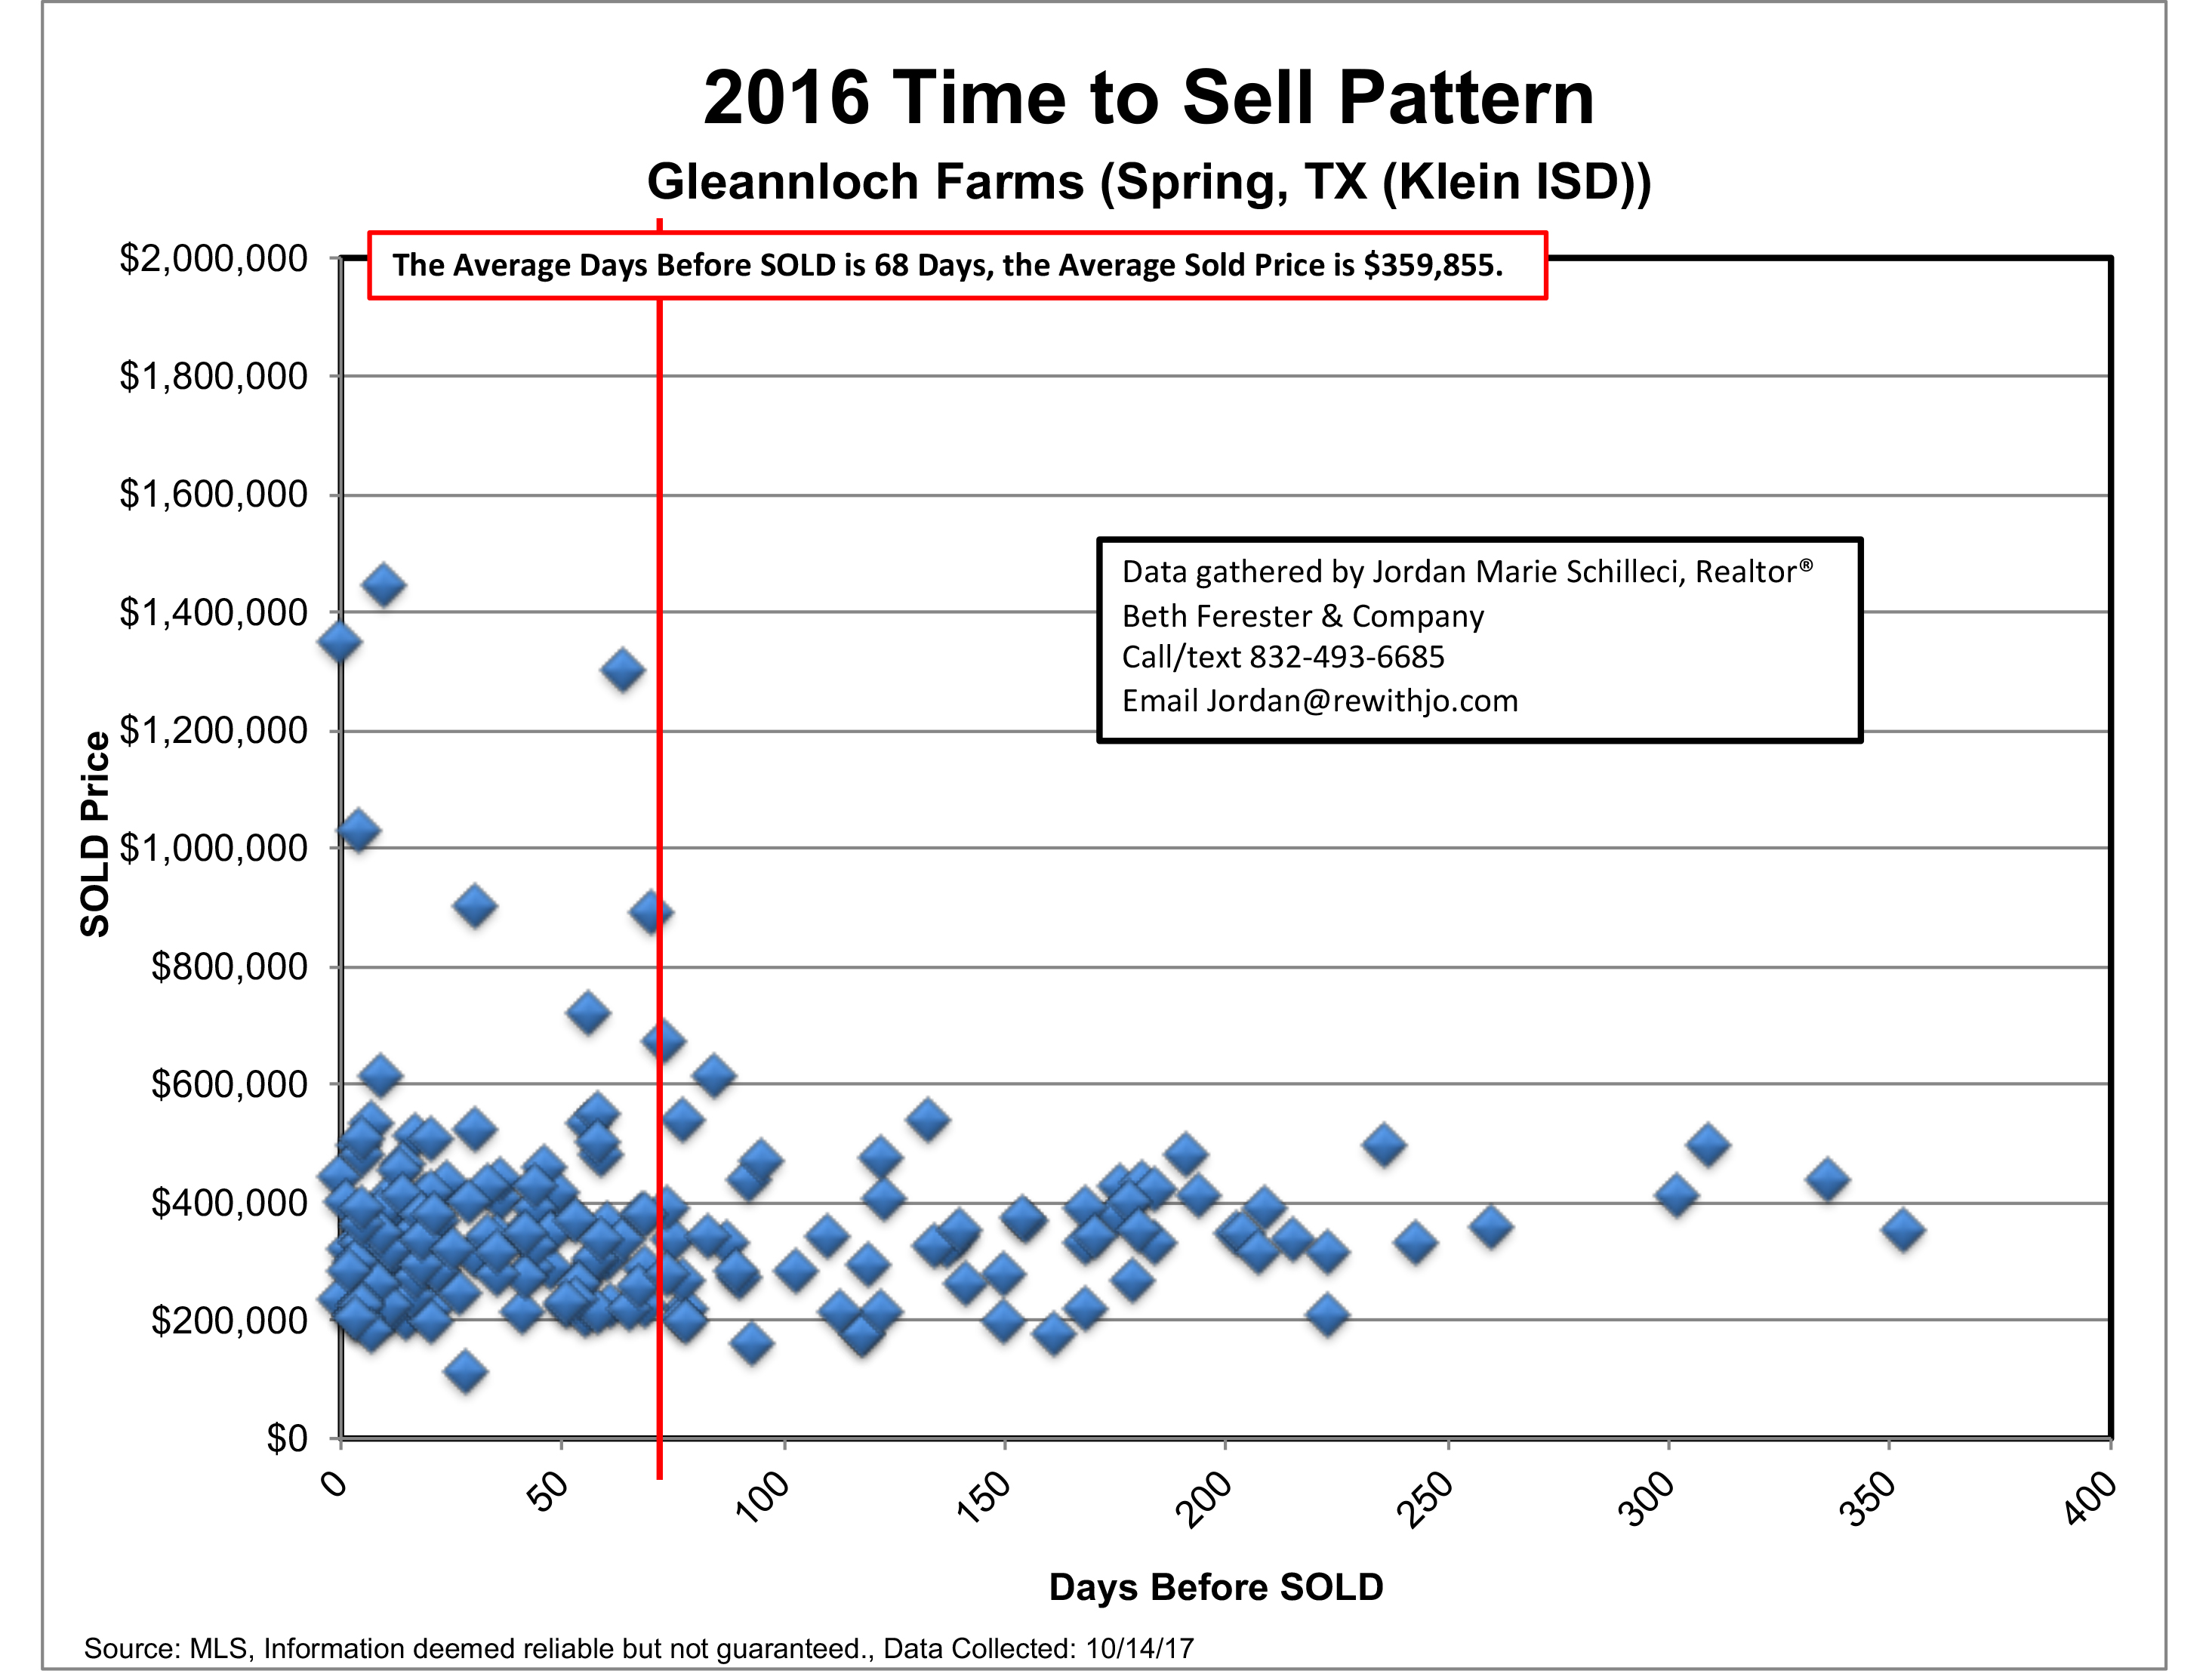
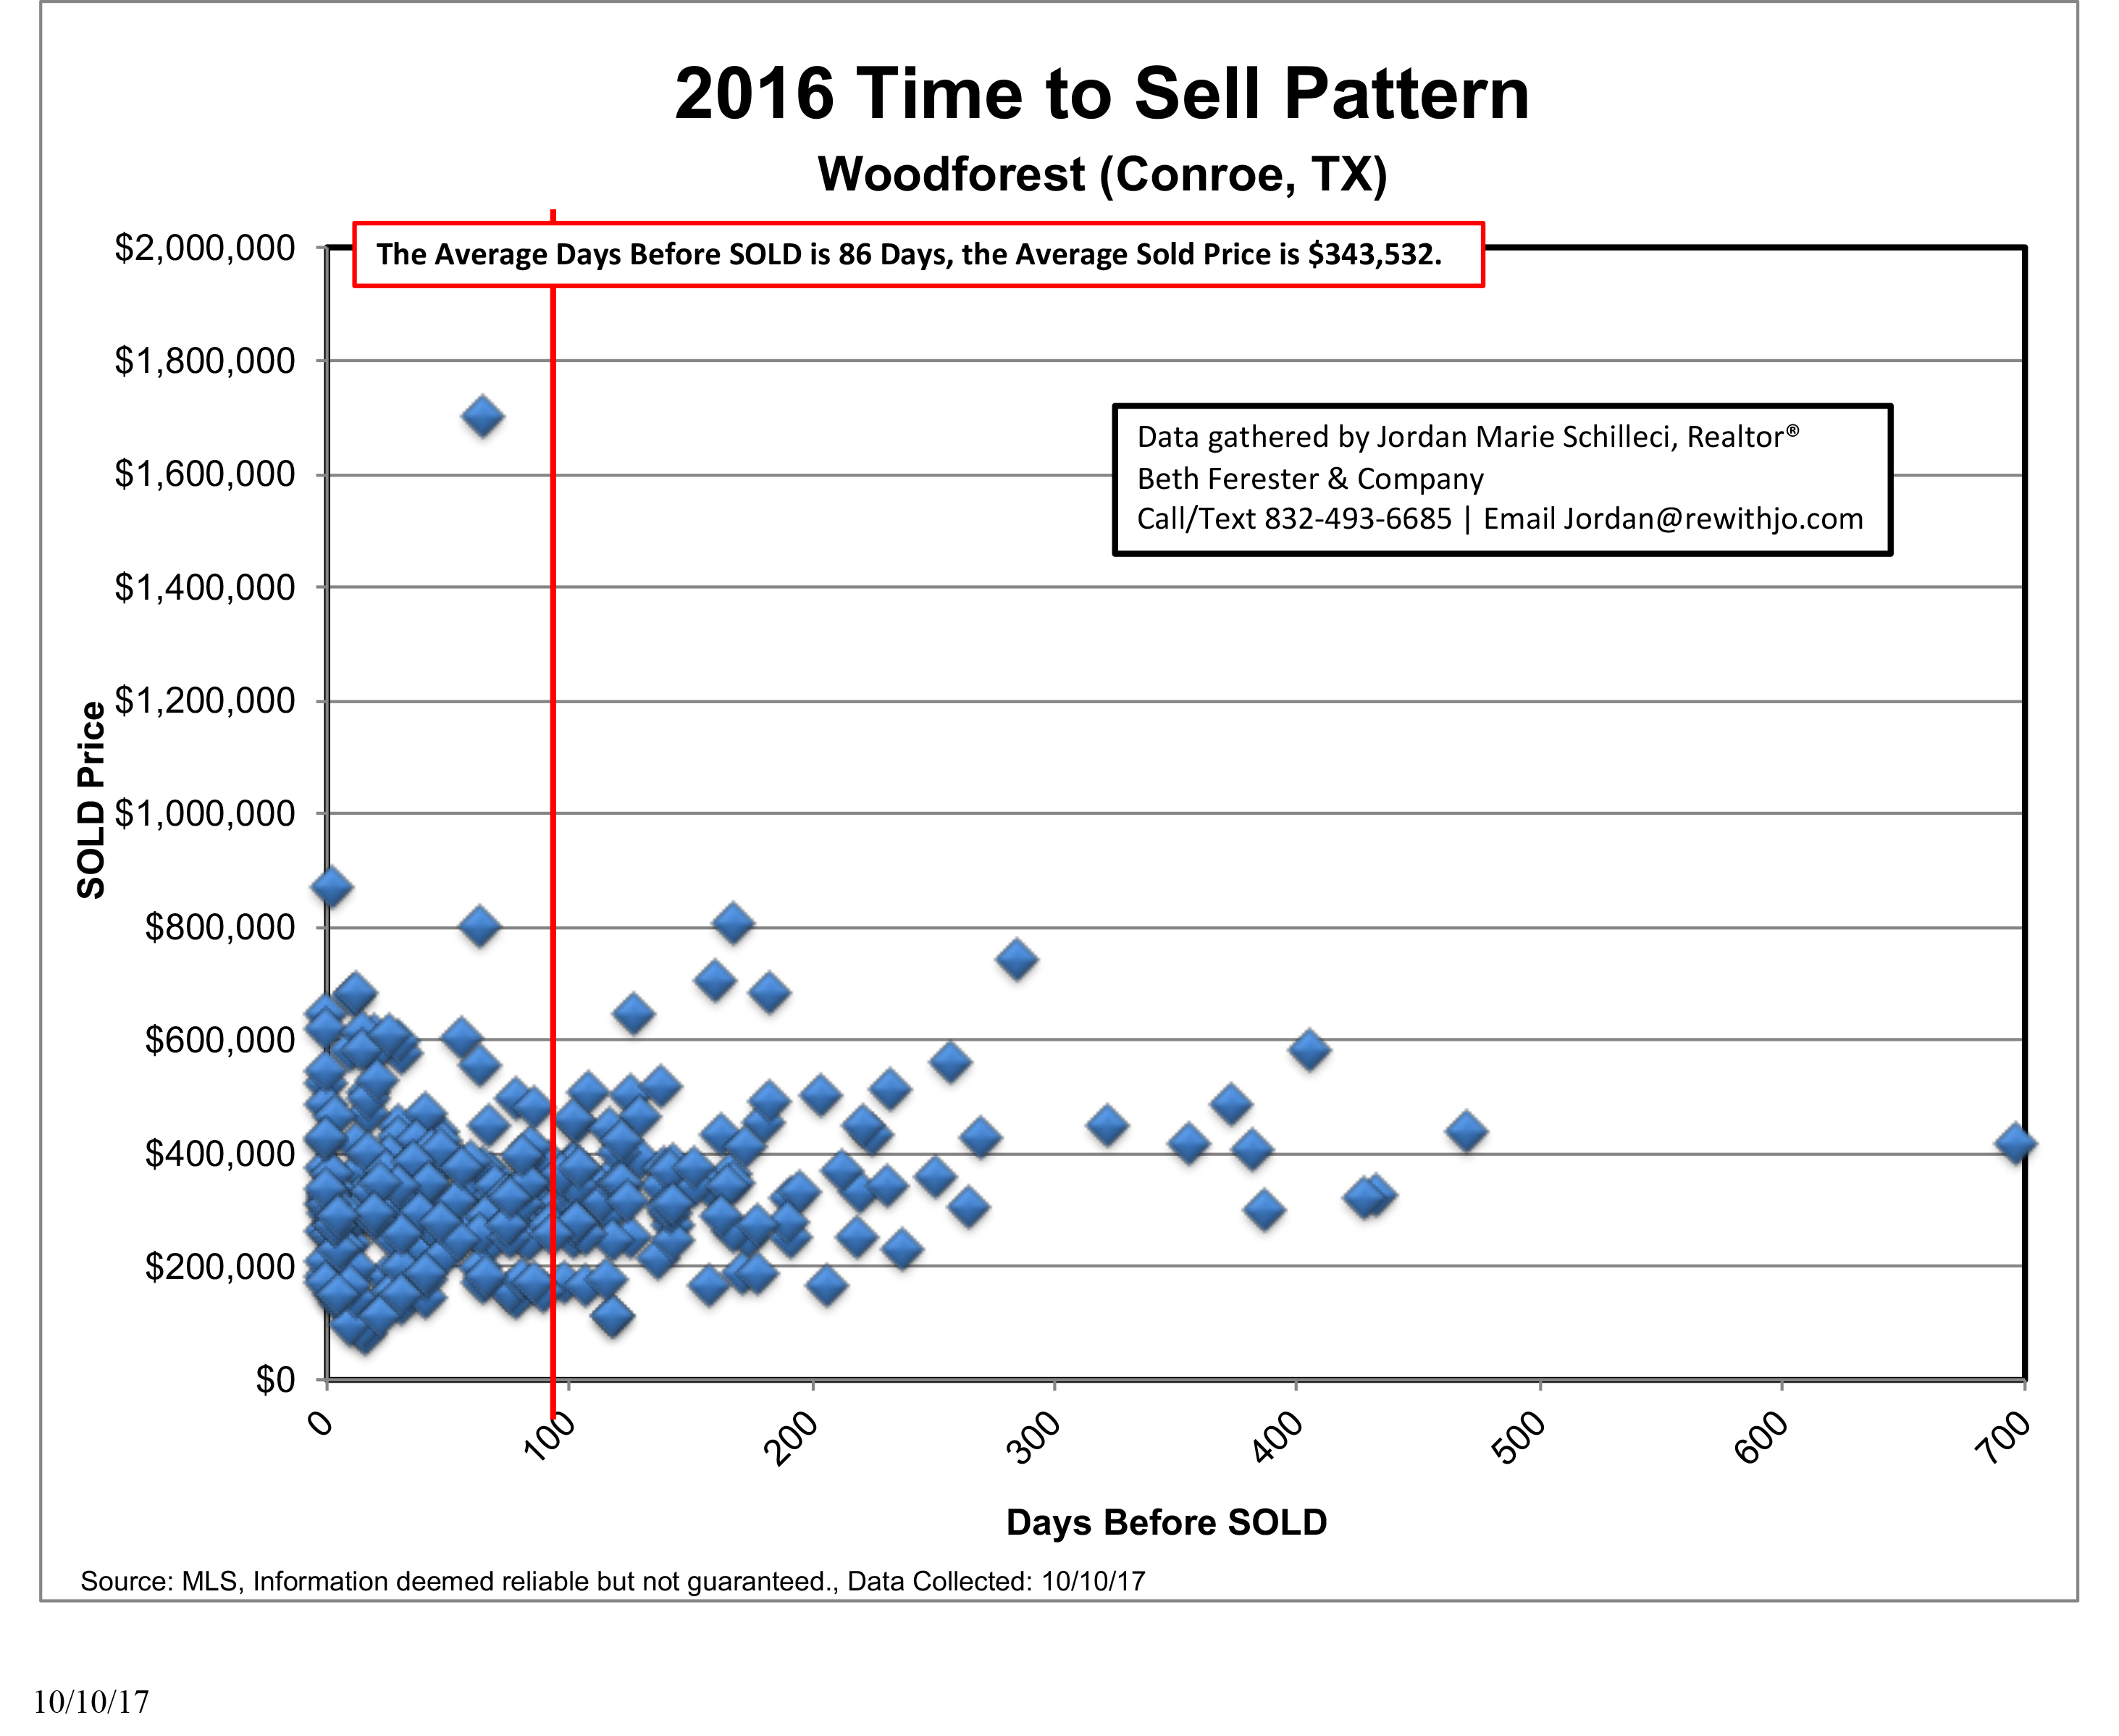
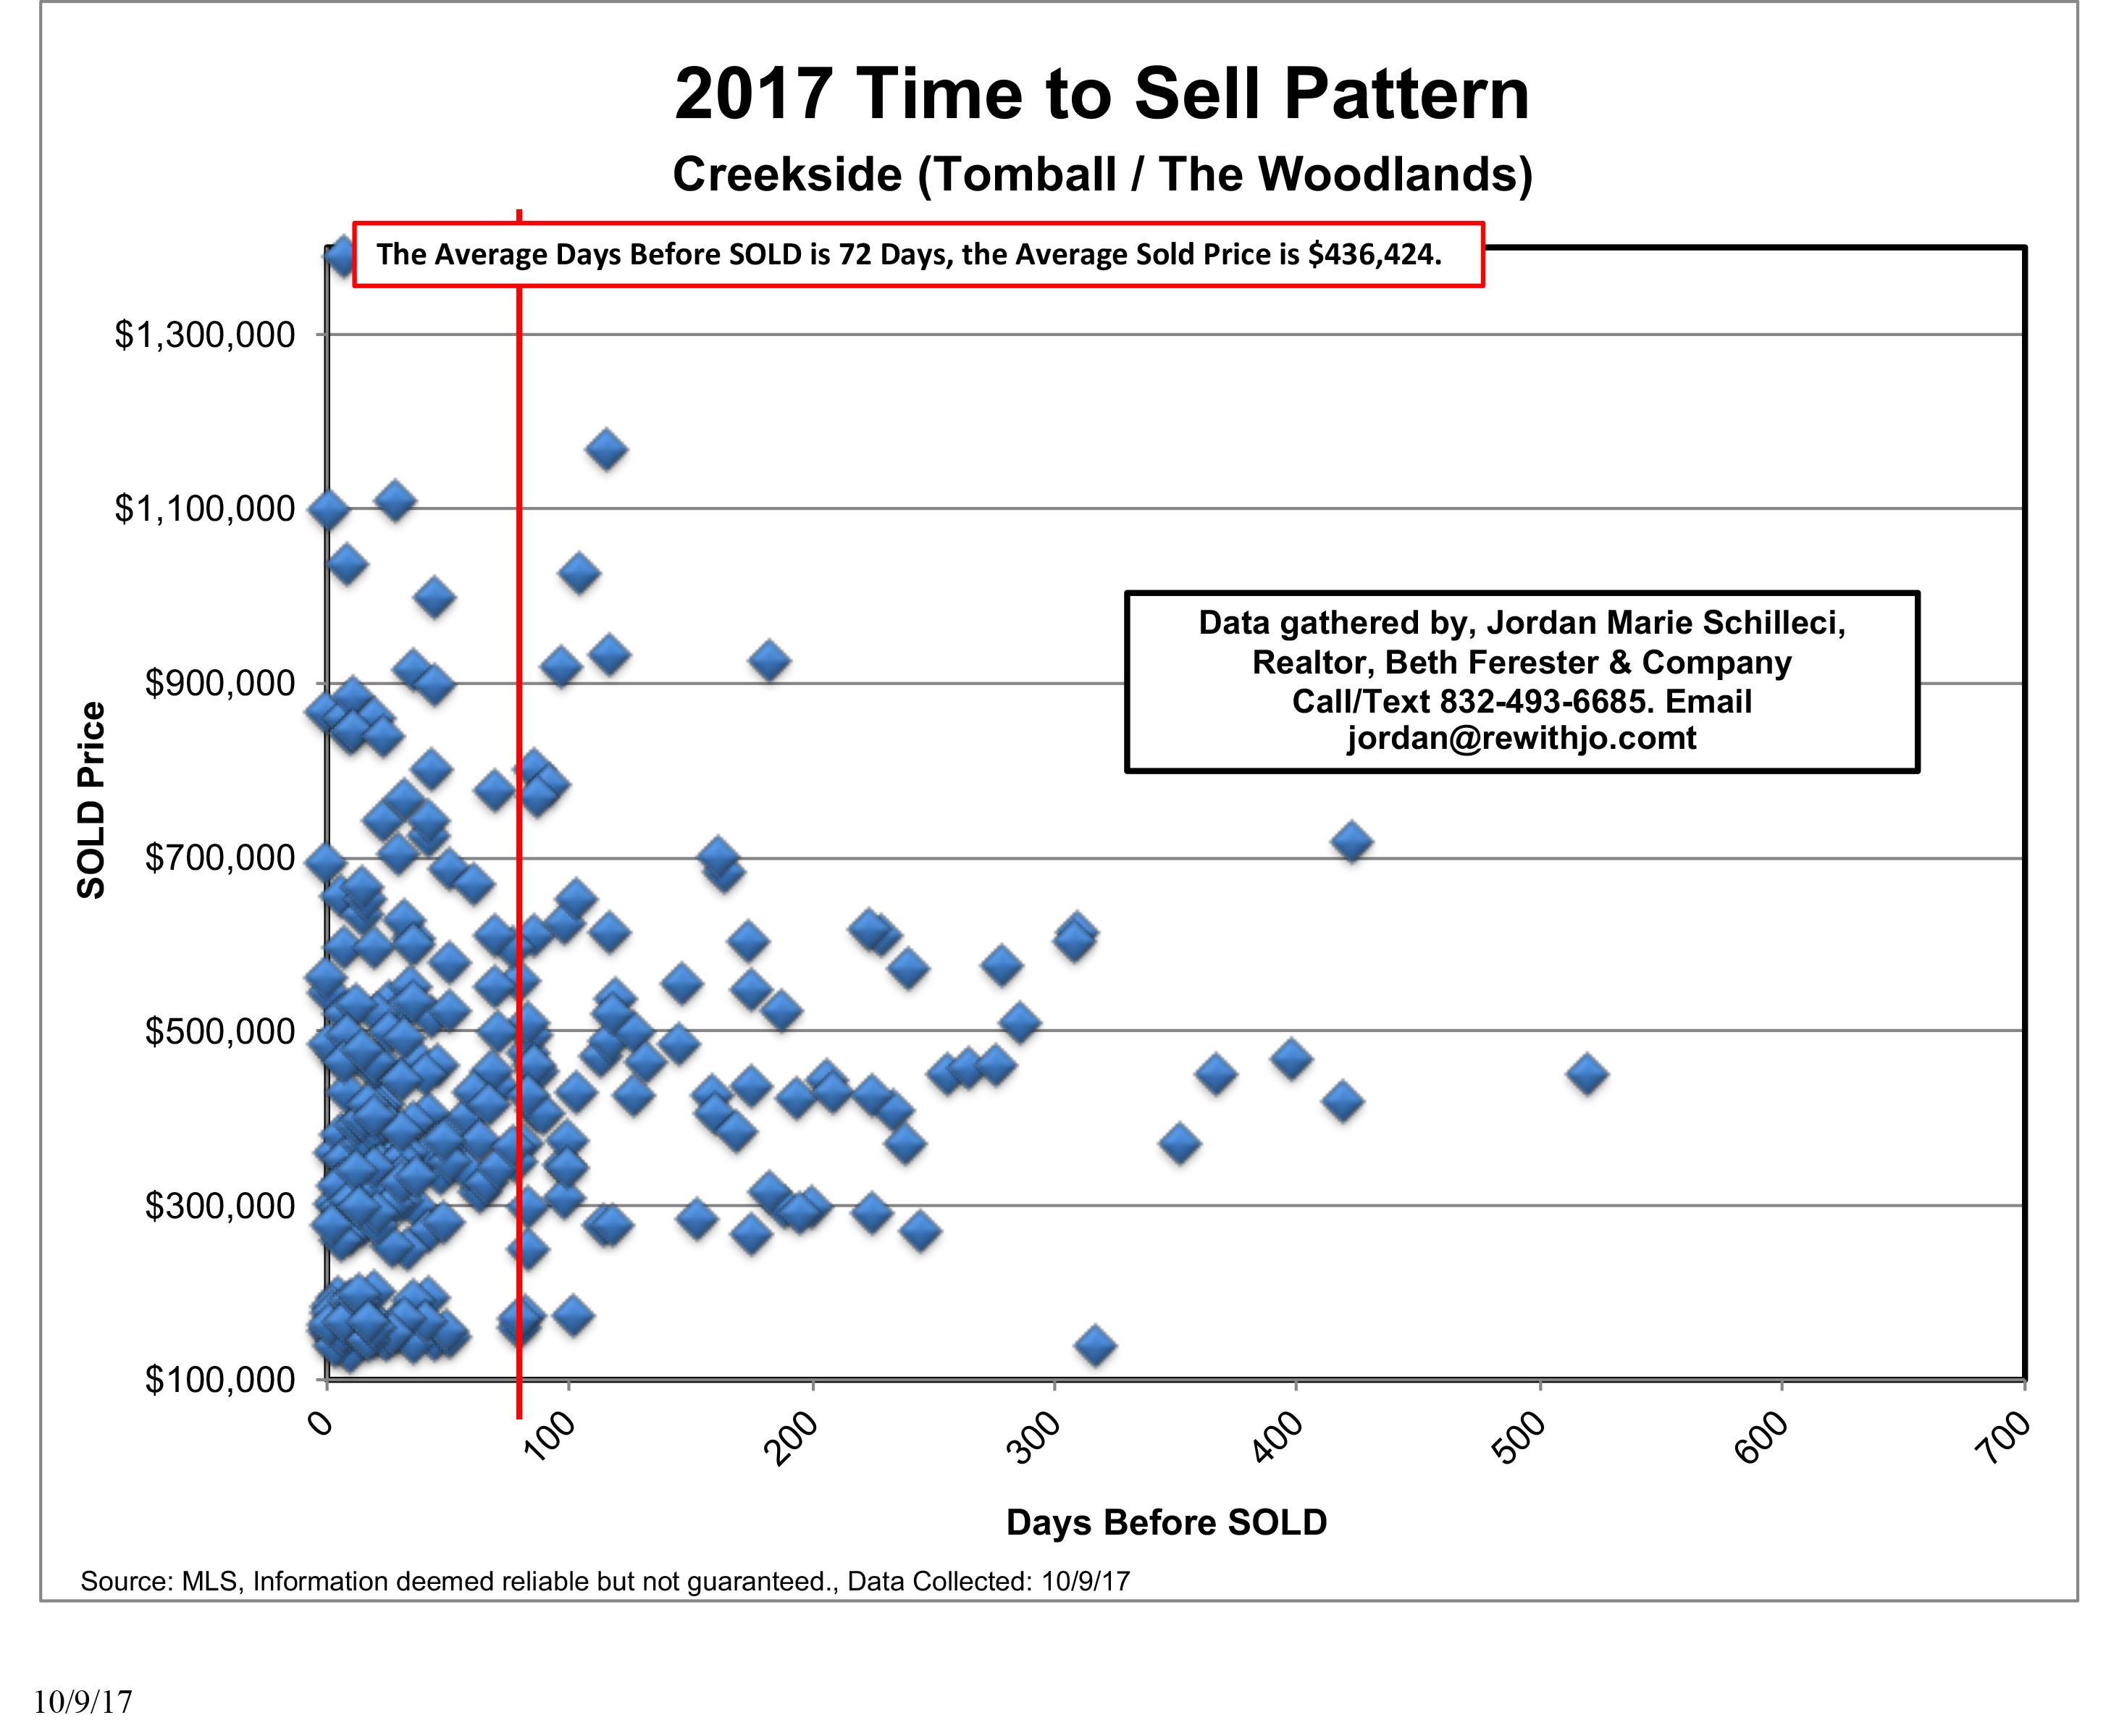
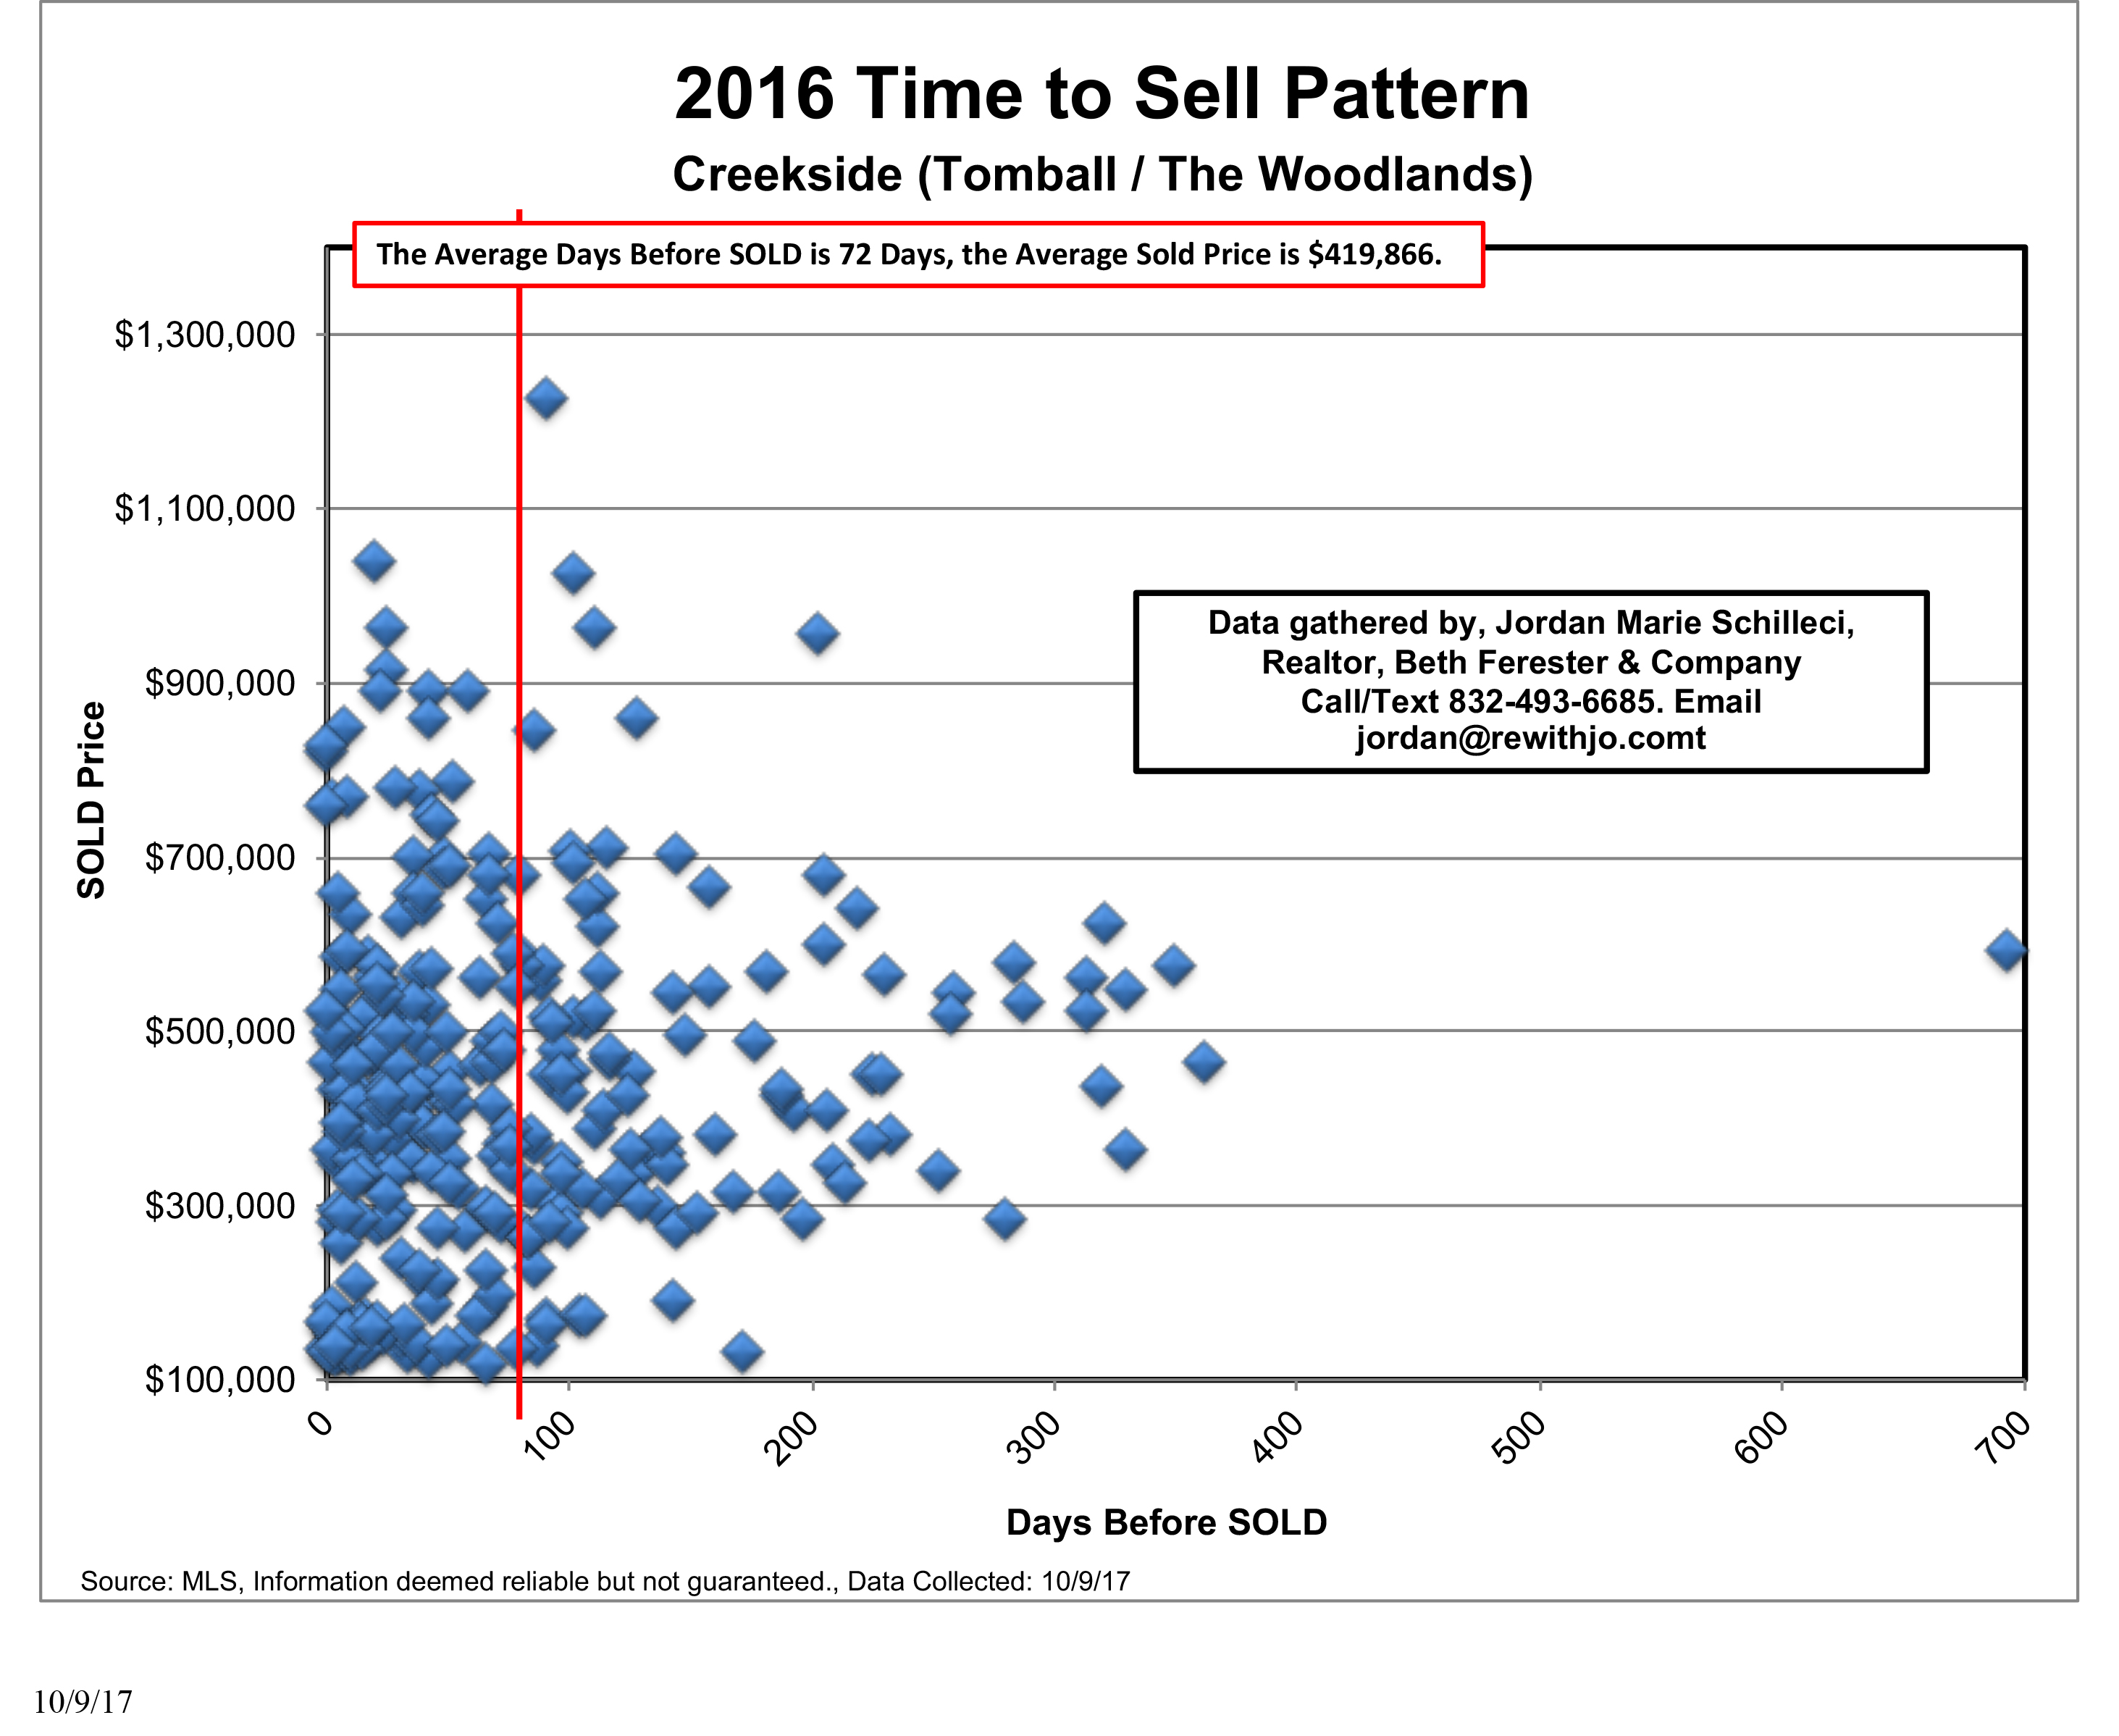
The average days on market for last year was 68 days and the average days on market for this year is
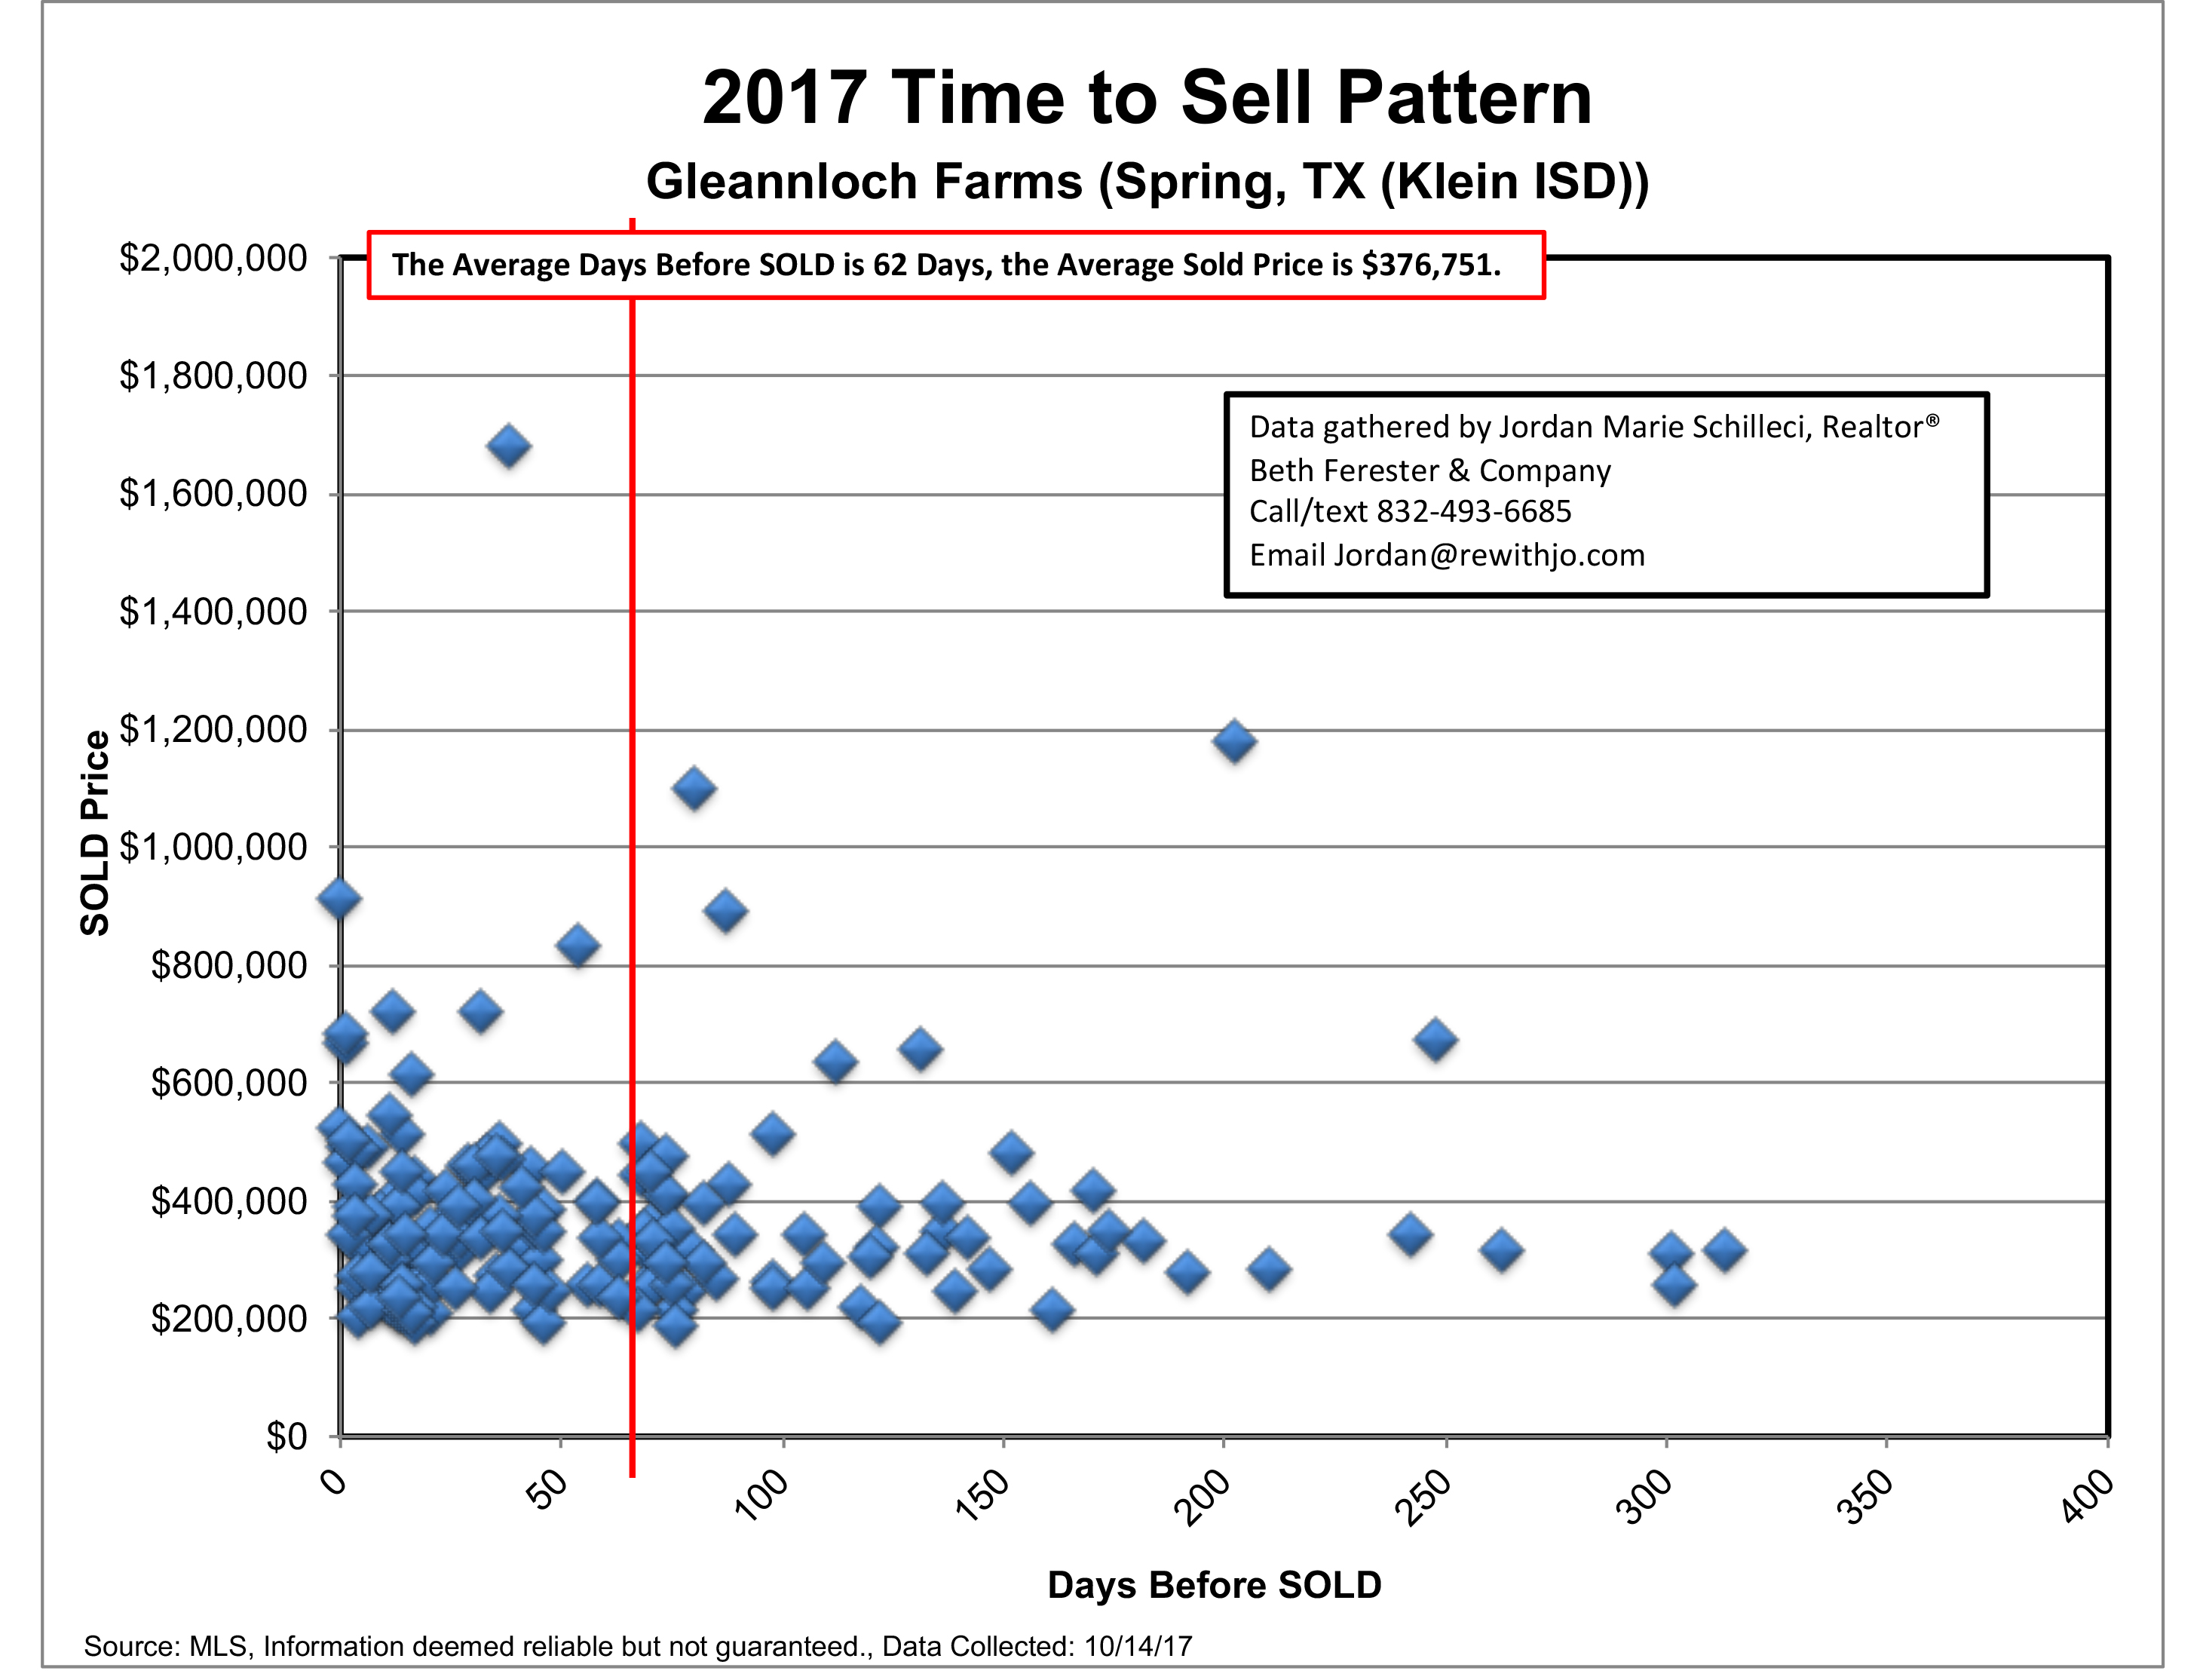
The coolest thing you learn when comparing the previous two graphs, is that the average sales price of home is up by almost $17,000! Hello equity.
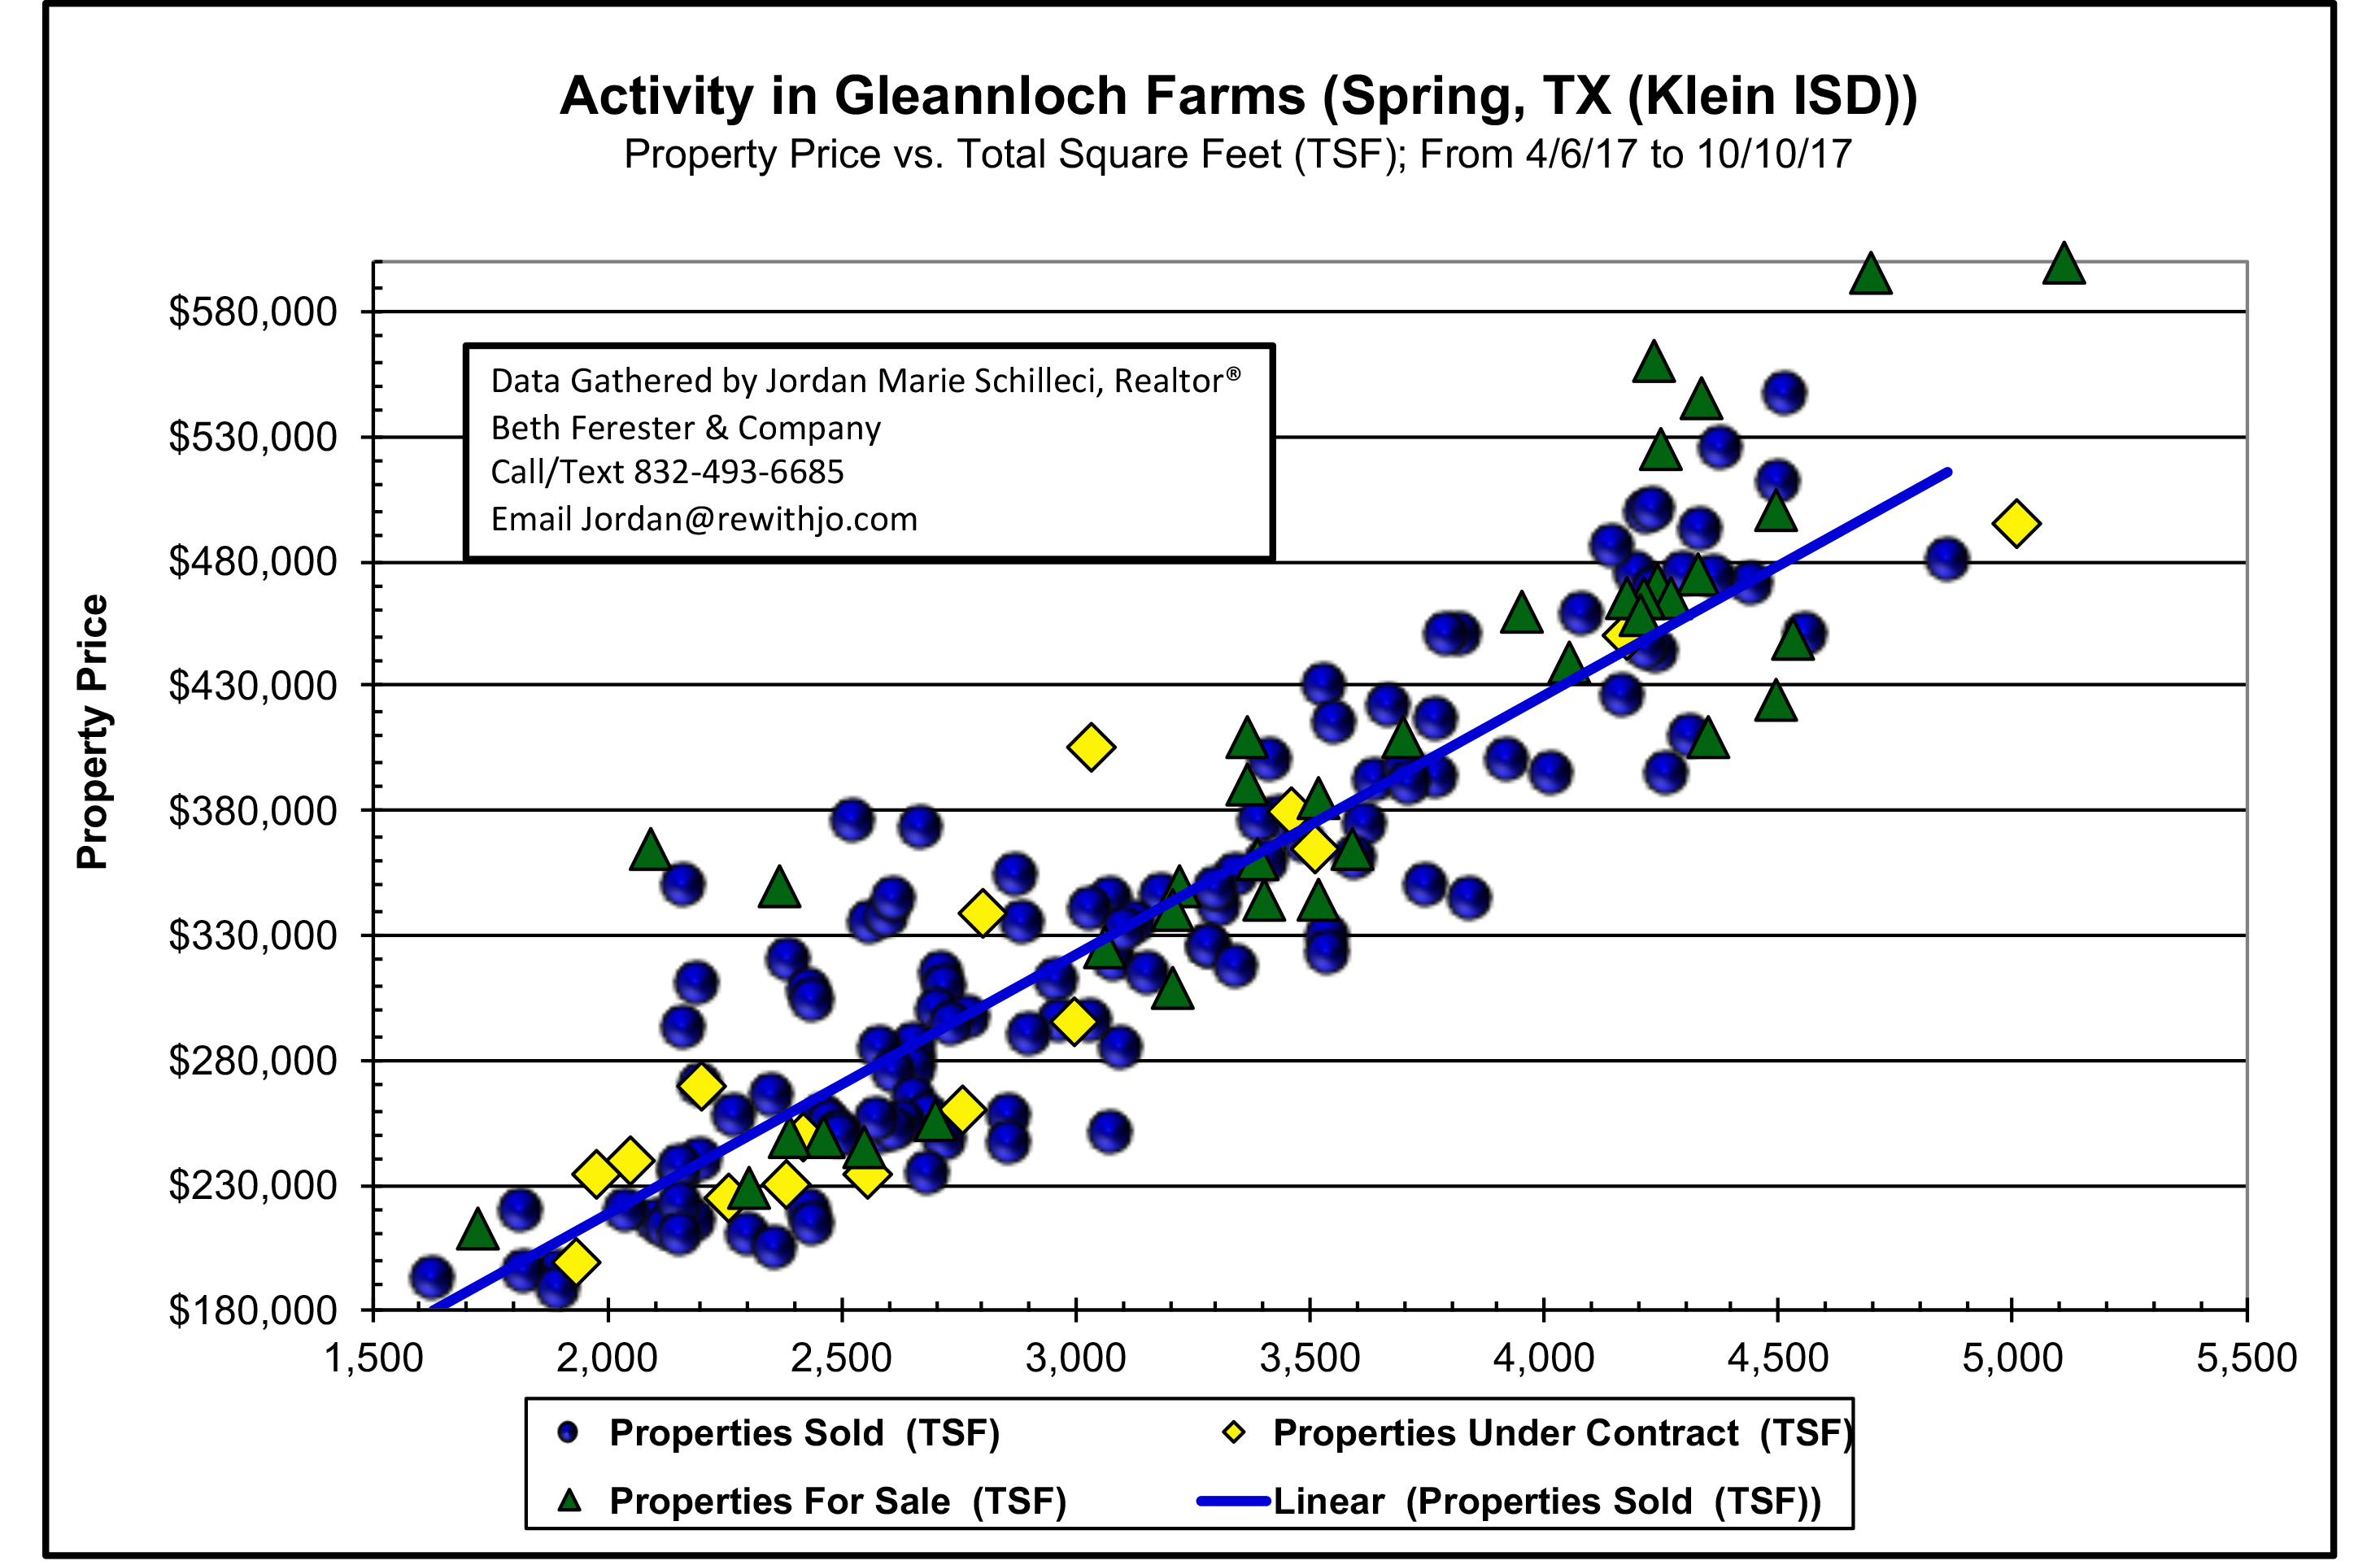
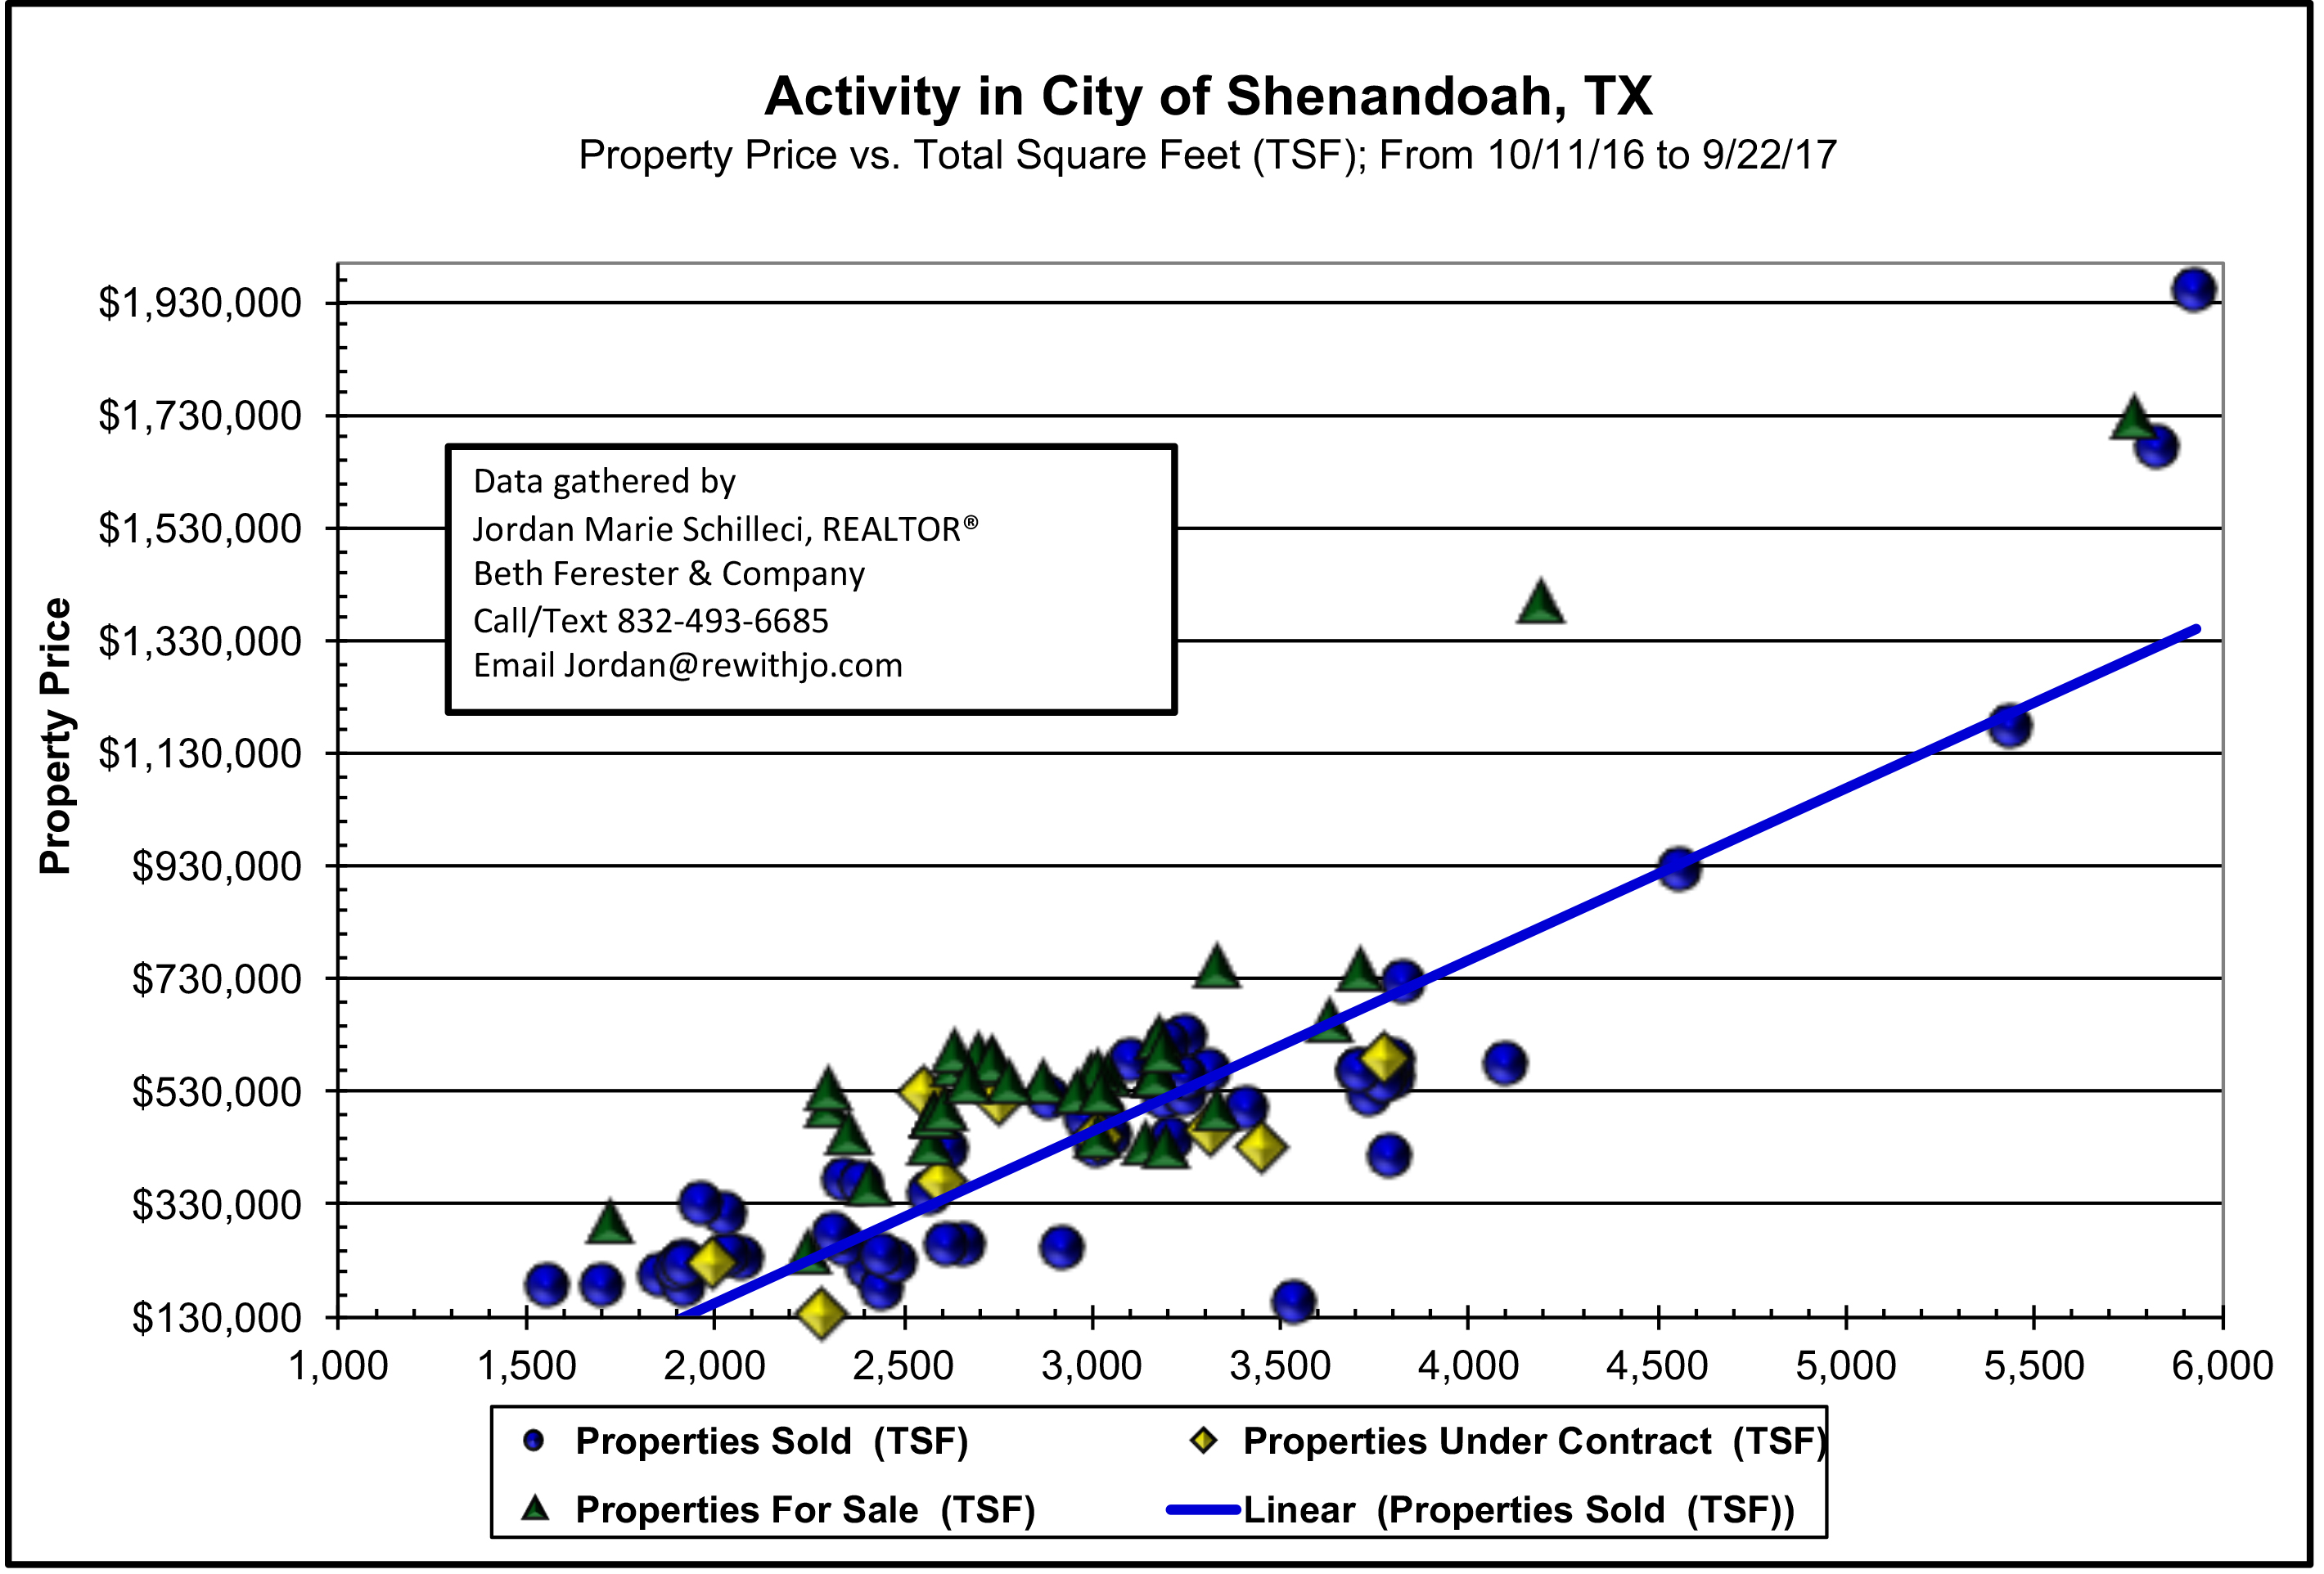
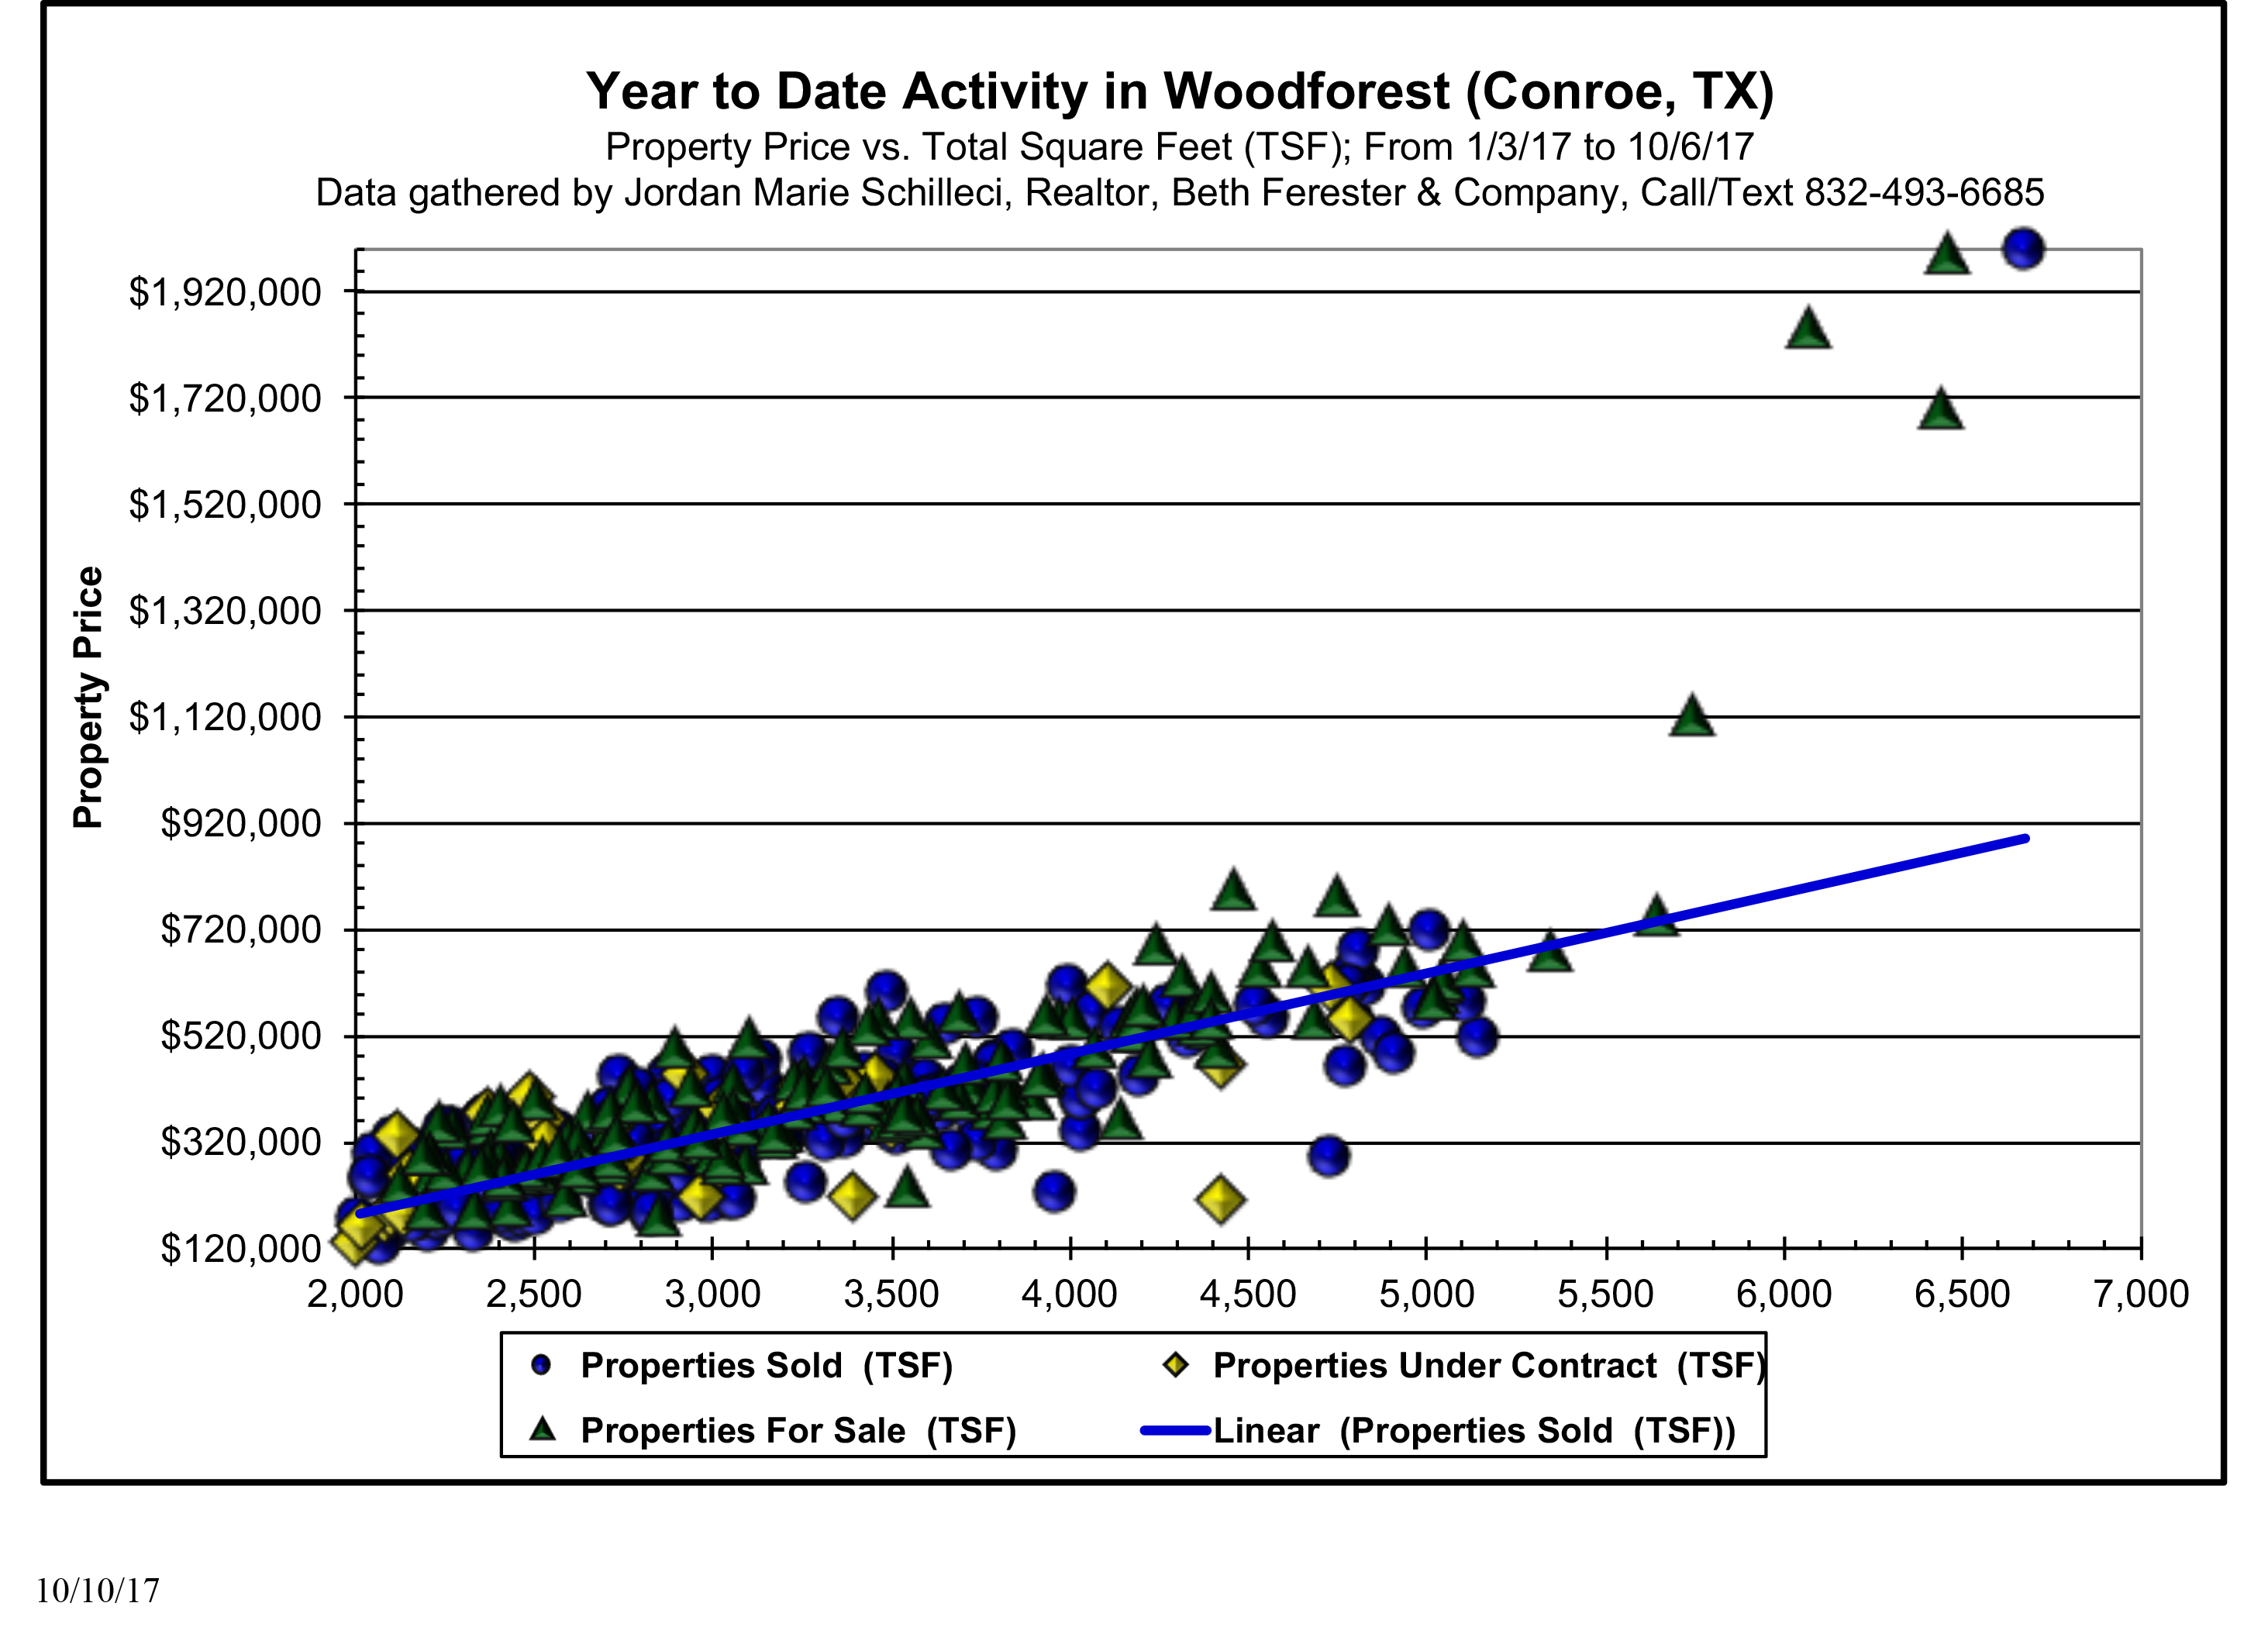
Now time for my favorite graph, the scattergram. For this one, I focused it on all the homes for sale and that have sold, all $600,000 and under. When we zoom in on the bulk of the homes, it is easier to read the corresponding property price to square feet.
If you need some more specific data, please reach out to me. Until tomorrow.. 🙂
Your Realtor,
Jordan Marie Schilleci, REALTOR®
Beth Ferester & Company
Call/Text 832-493-6685


