I don’t frequent The Heights all too often, minus heading down to 19th Street for some Penzey Spices (best spices in the world!) or an occasional antique shopping run, but I do know the market down there is a “hot one”. Today, on my #5AMDESK podcast (Episode 19), I dove into more details.
The Heights Market Data


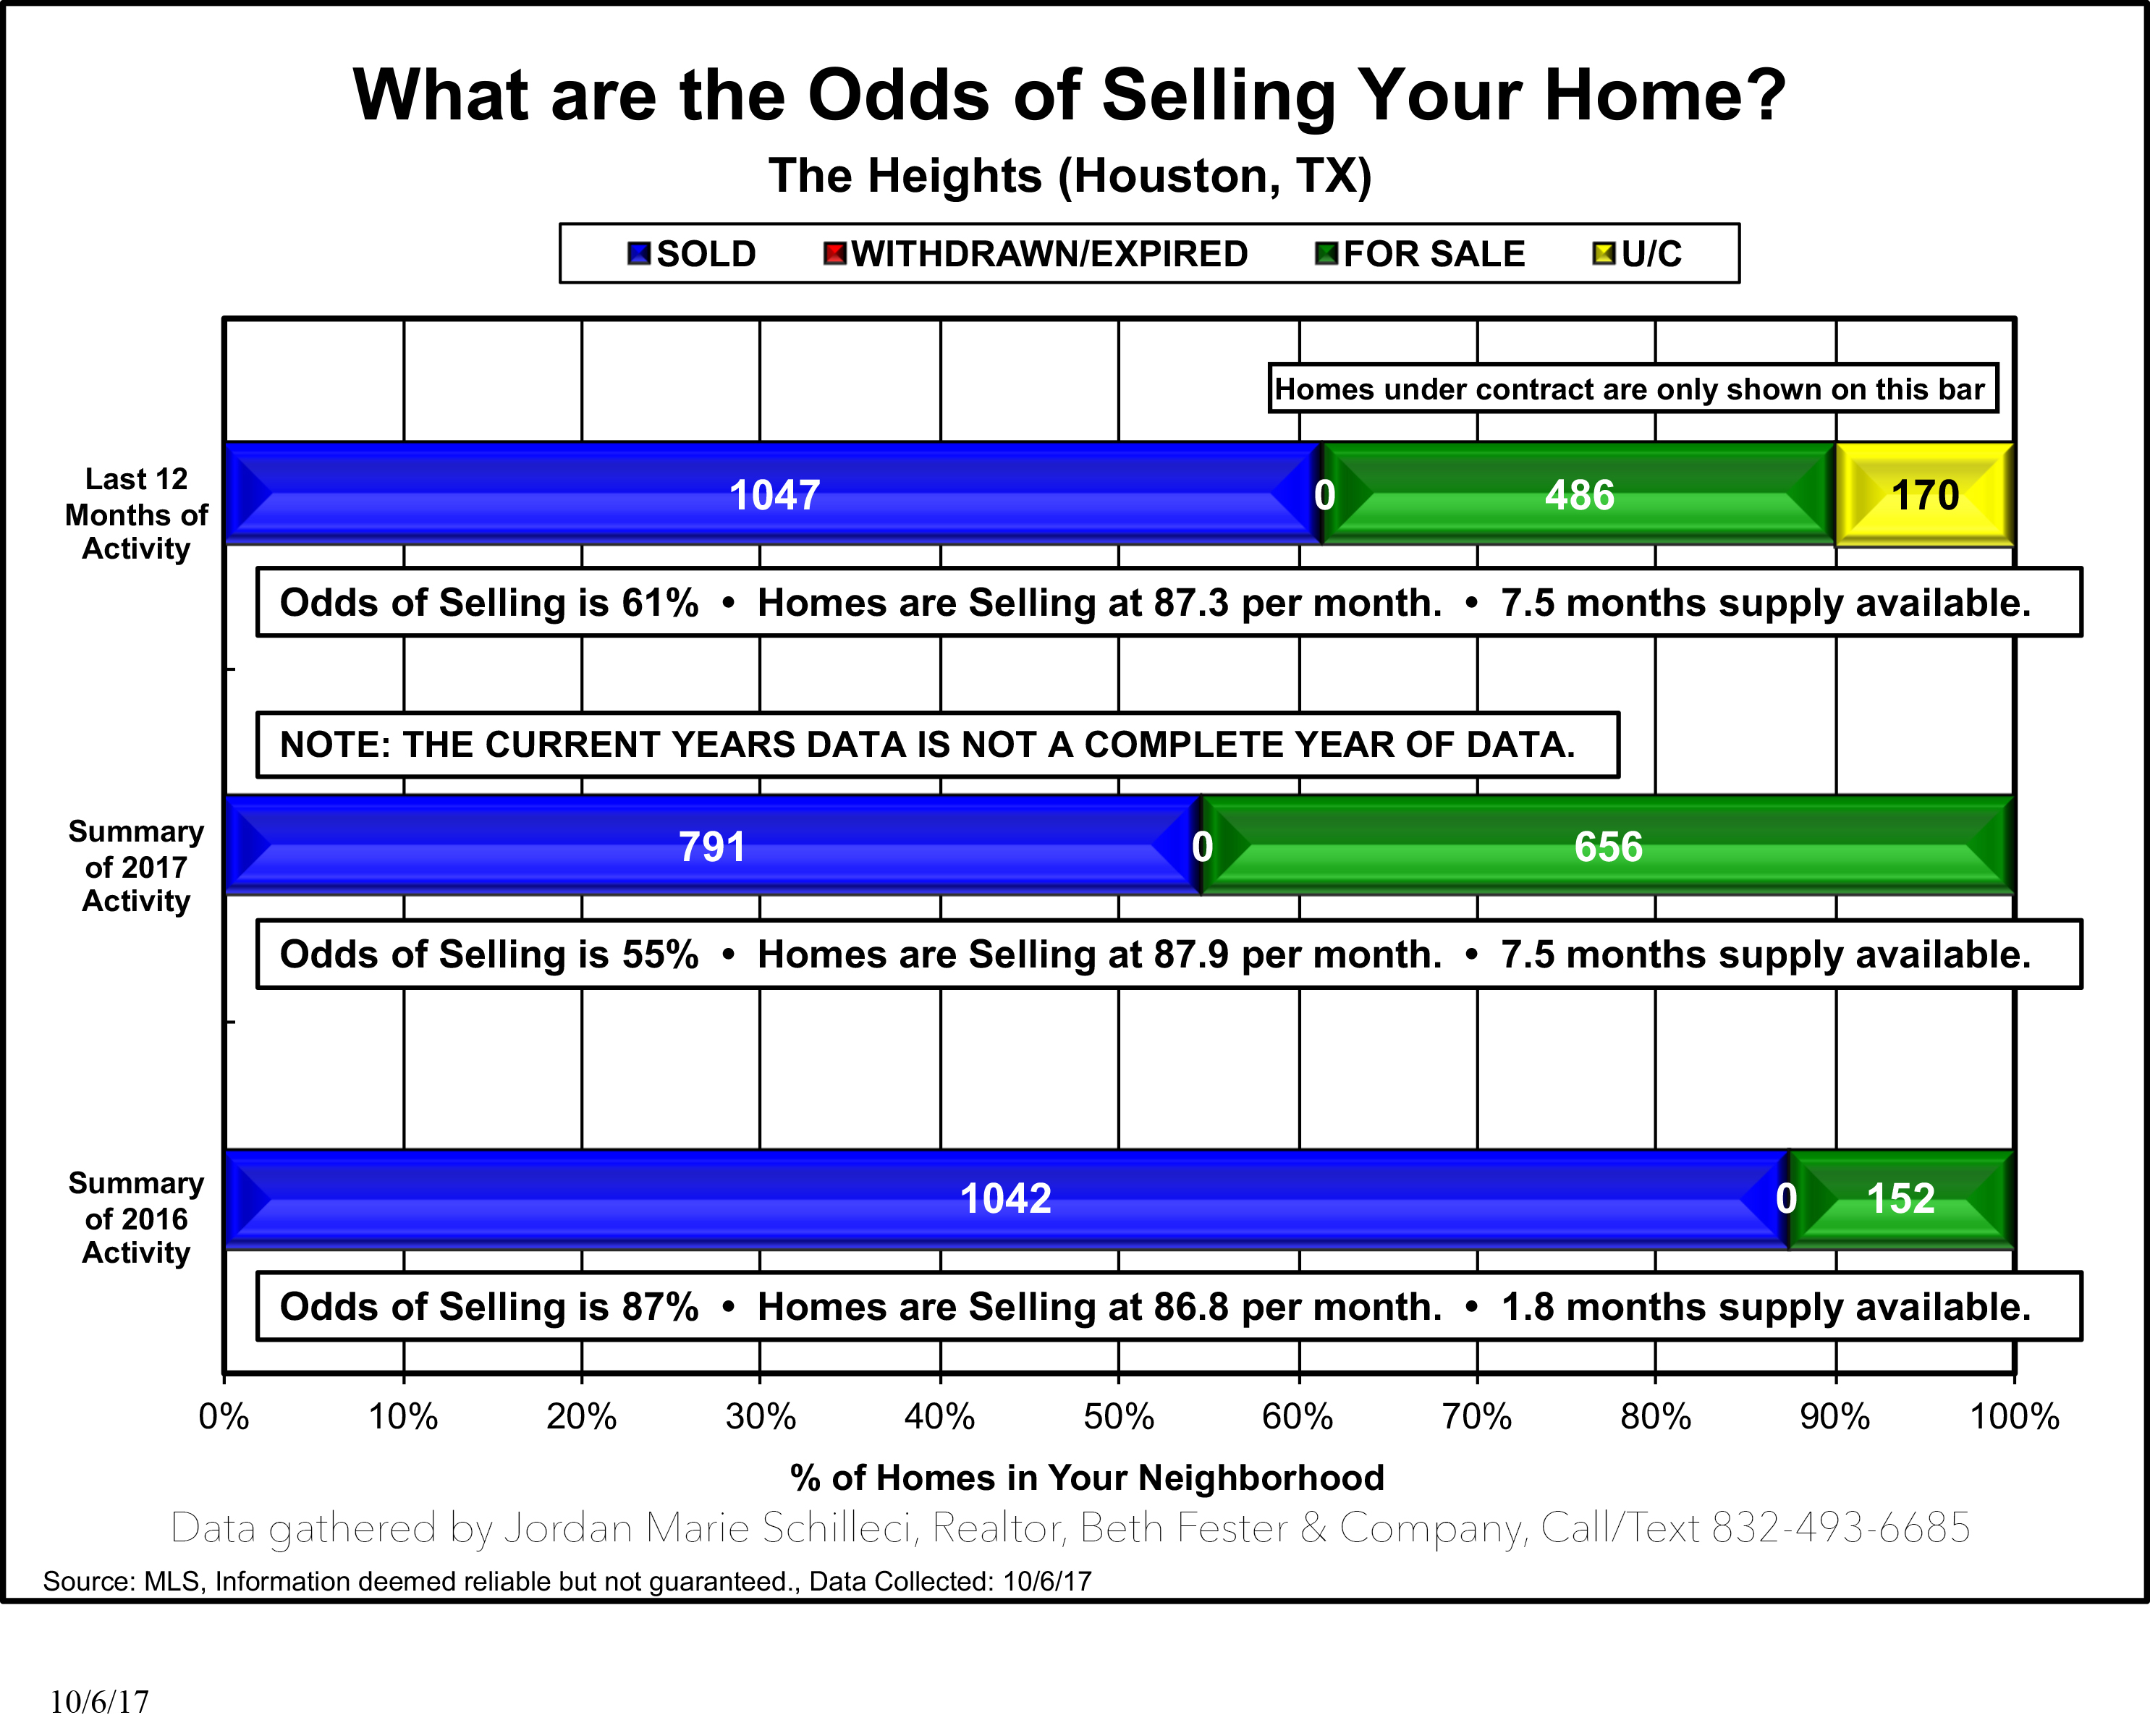
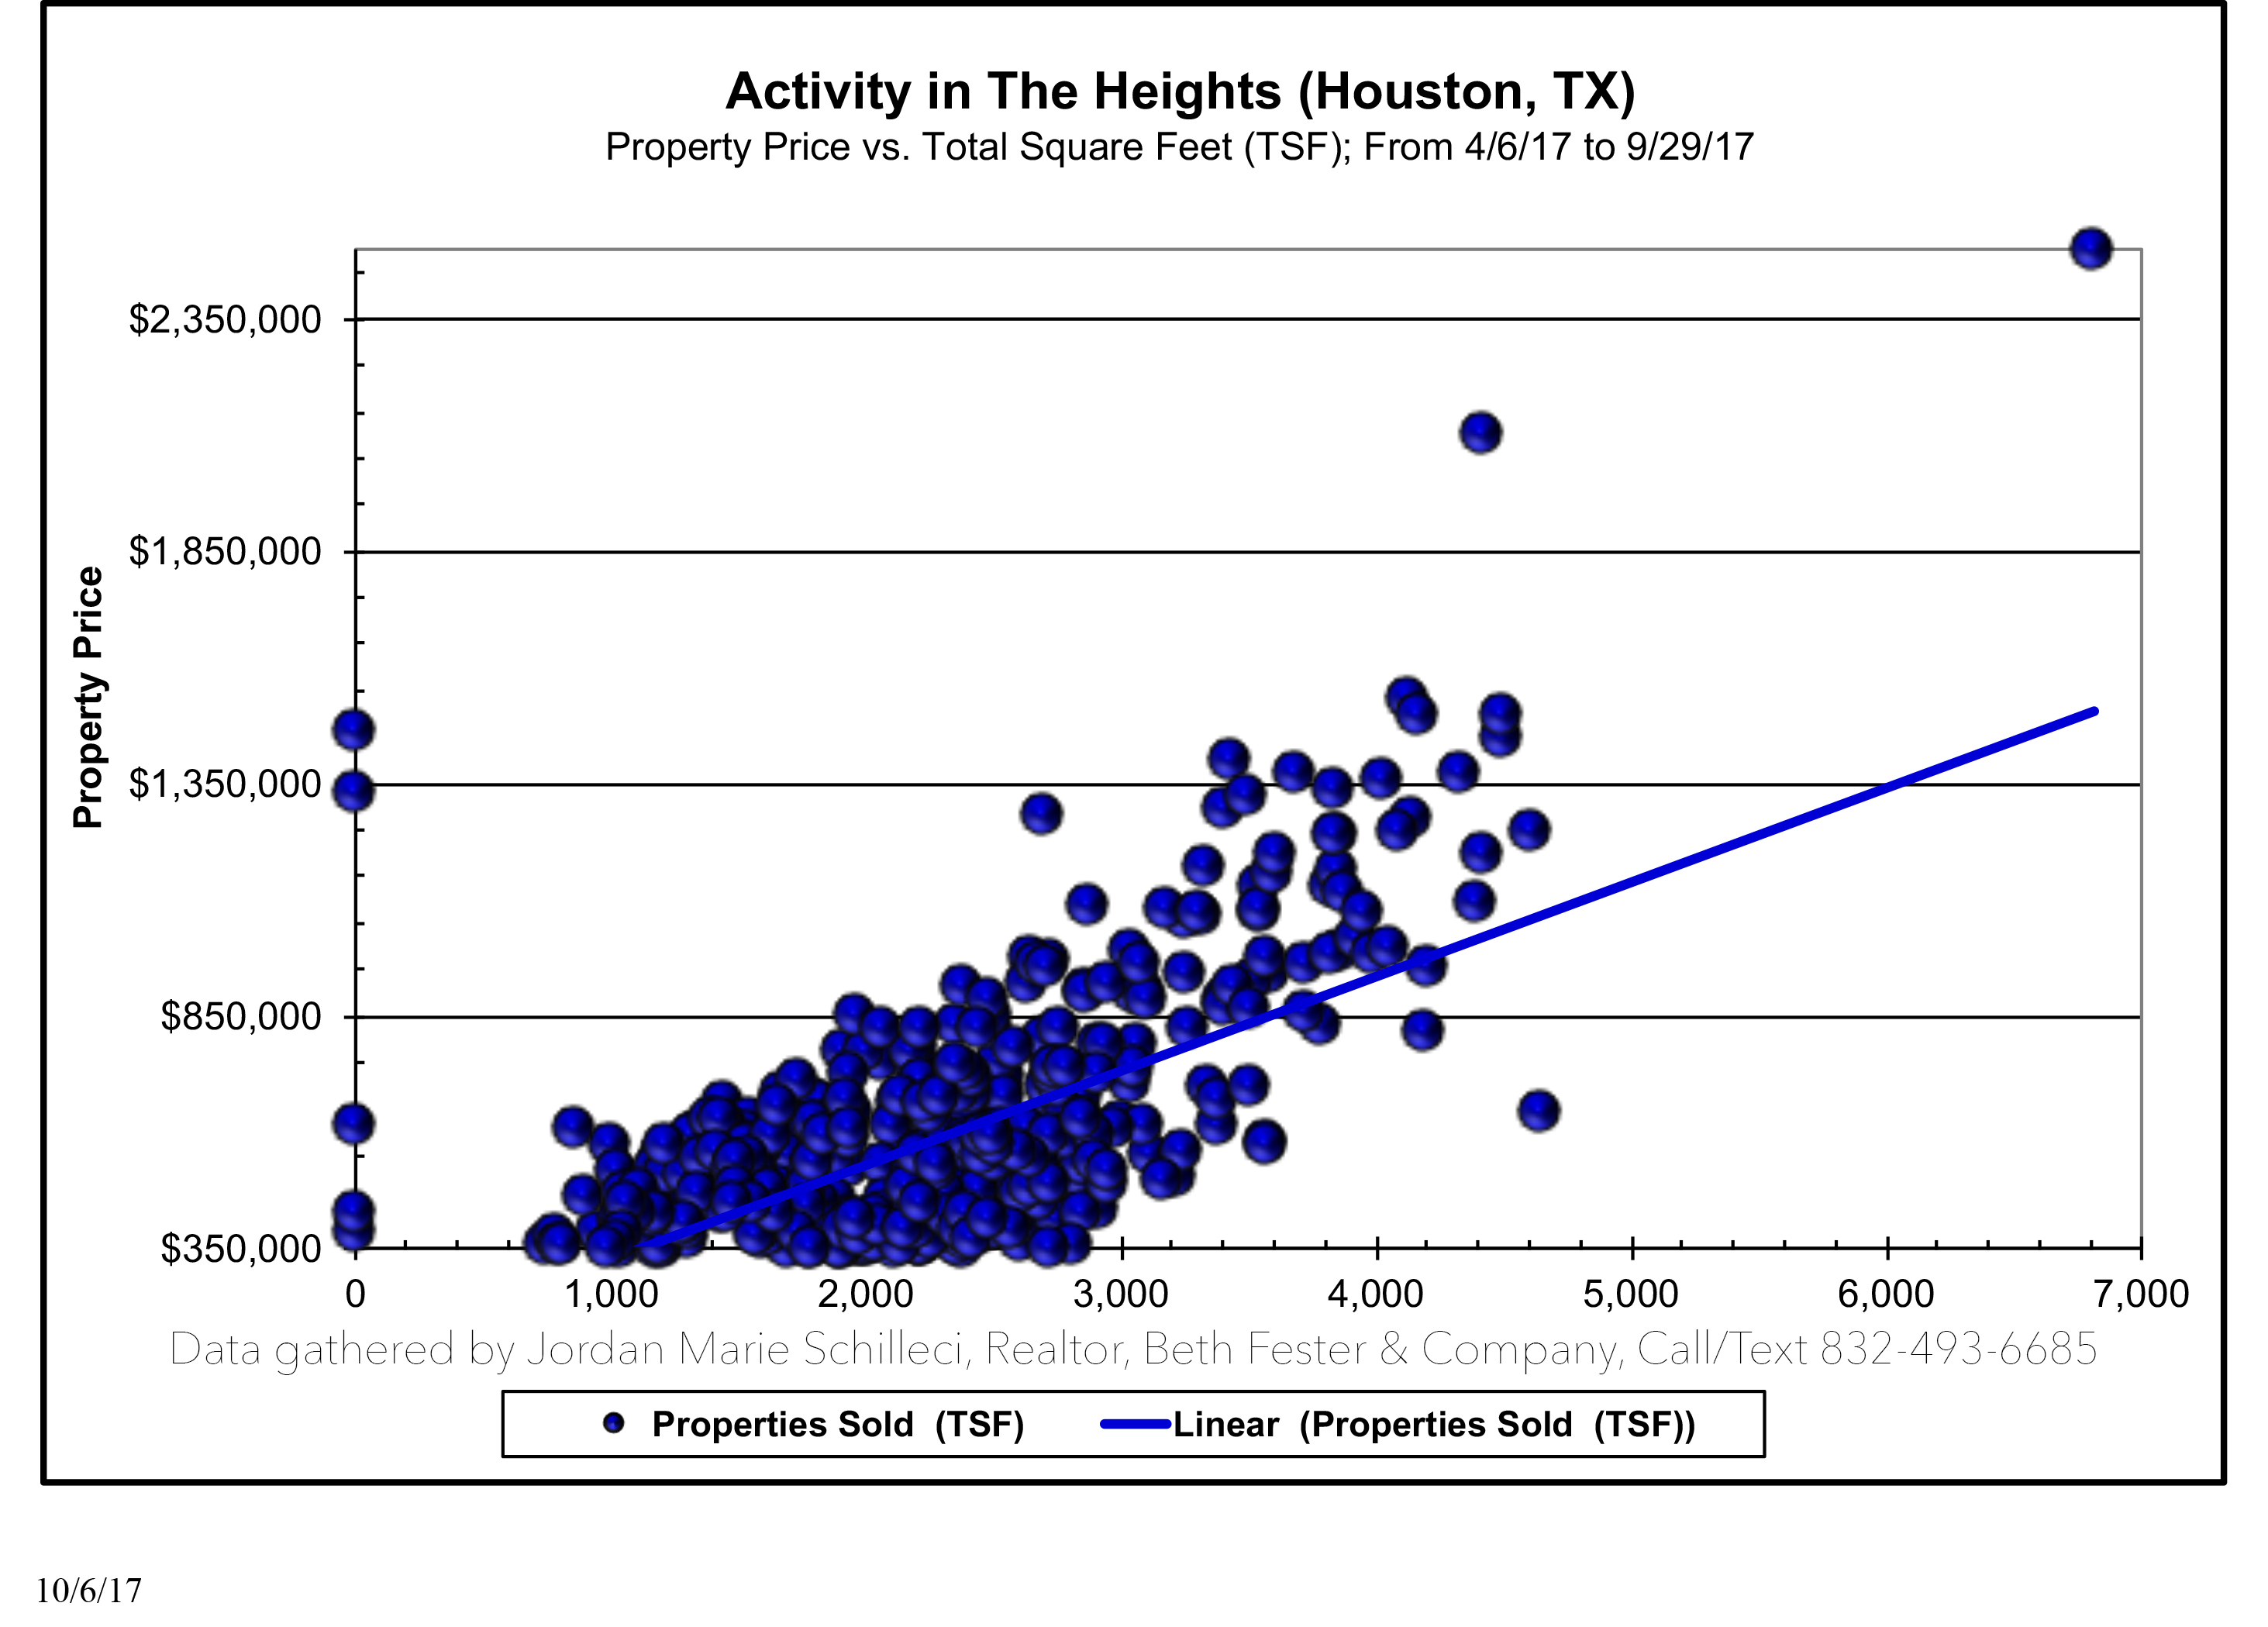
As you can see, the above graph starts at $350,000. The maximum amount of data I can easily compute is 5000 entries, so that is why I chose to start at $350,000. The reason why this graph is so congested, is one, because there are so many houses bought and sold in The Heights, but the graph looks the way it does, due to half of the houses being sold renovated and not renovated.
The days on the market in 2016 was 68 and in 2017 it dropped to 49. That is great for sellers. The bad part is the large amount of inventory, making it almost like a buyer’s market. There is currently 7.5 months of inventory in The Heights area.
Lakewood Forest Market Data
I love Lakewood Forest. We almost moved there. There schools are award winning, as part of it zones to Tomball ISD and the other part to Cypress-Fairbanks ISD. I love all the trees and all the character in the homes. Plus the location is very convenient to The Vintage and Highway 249.

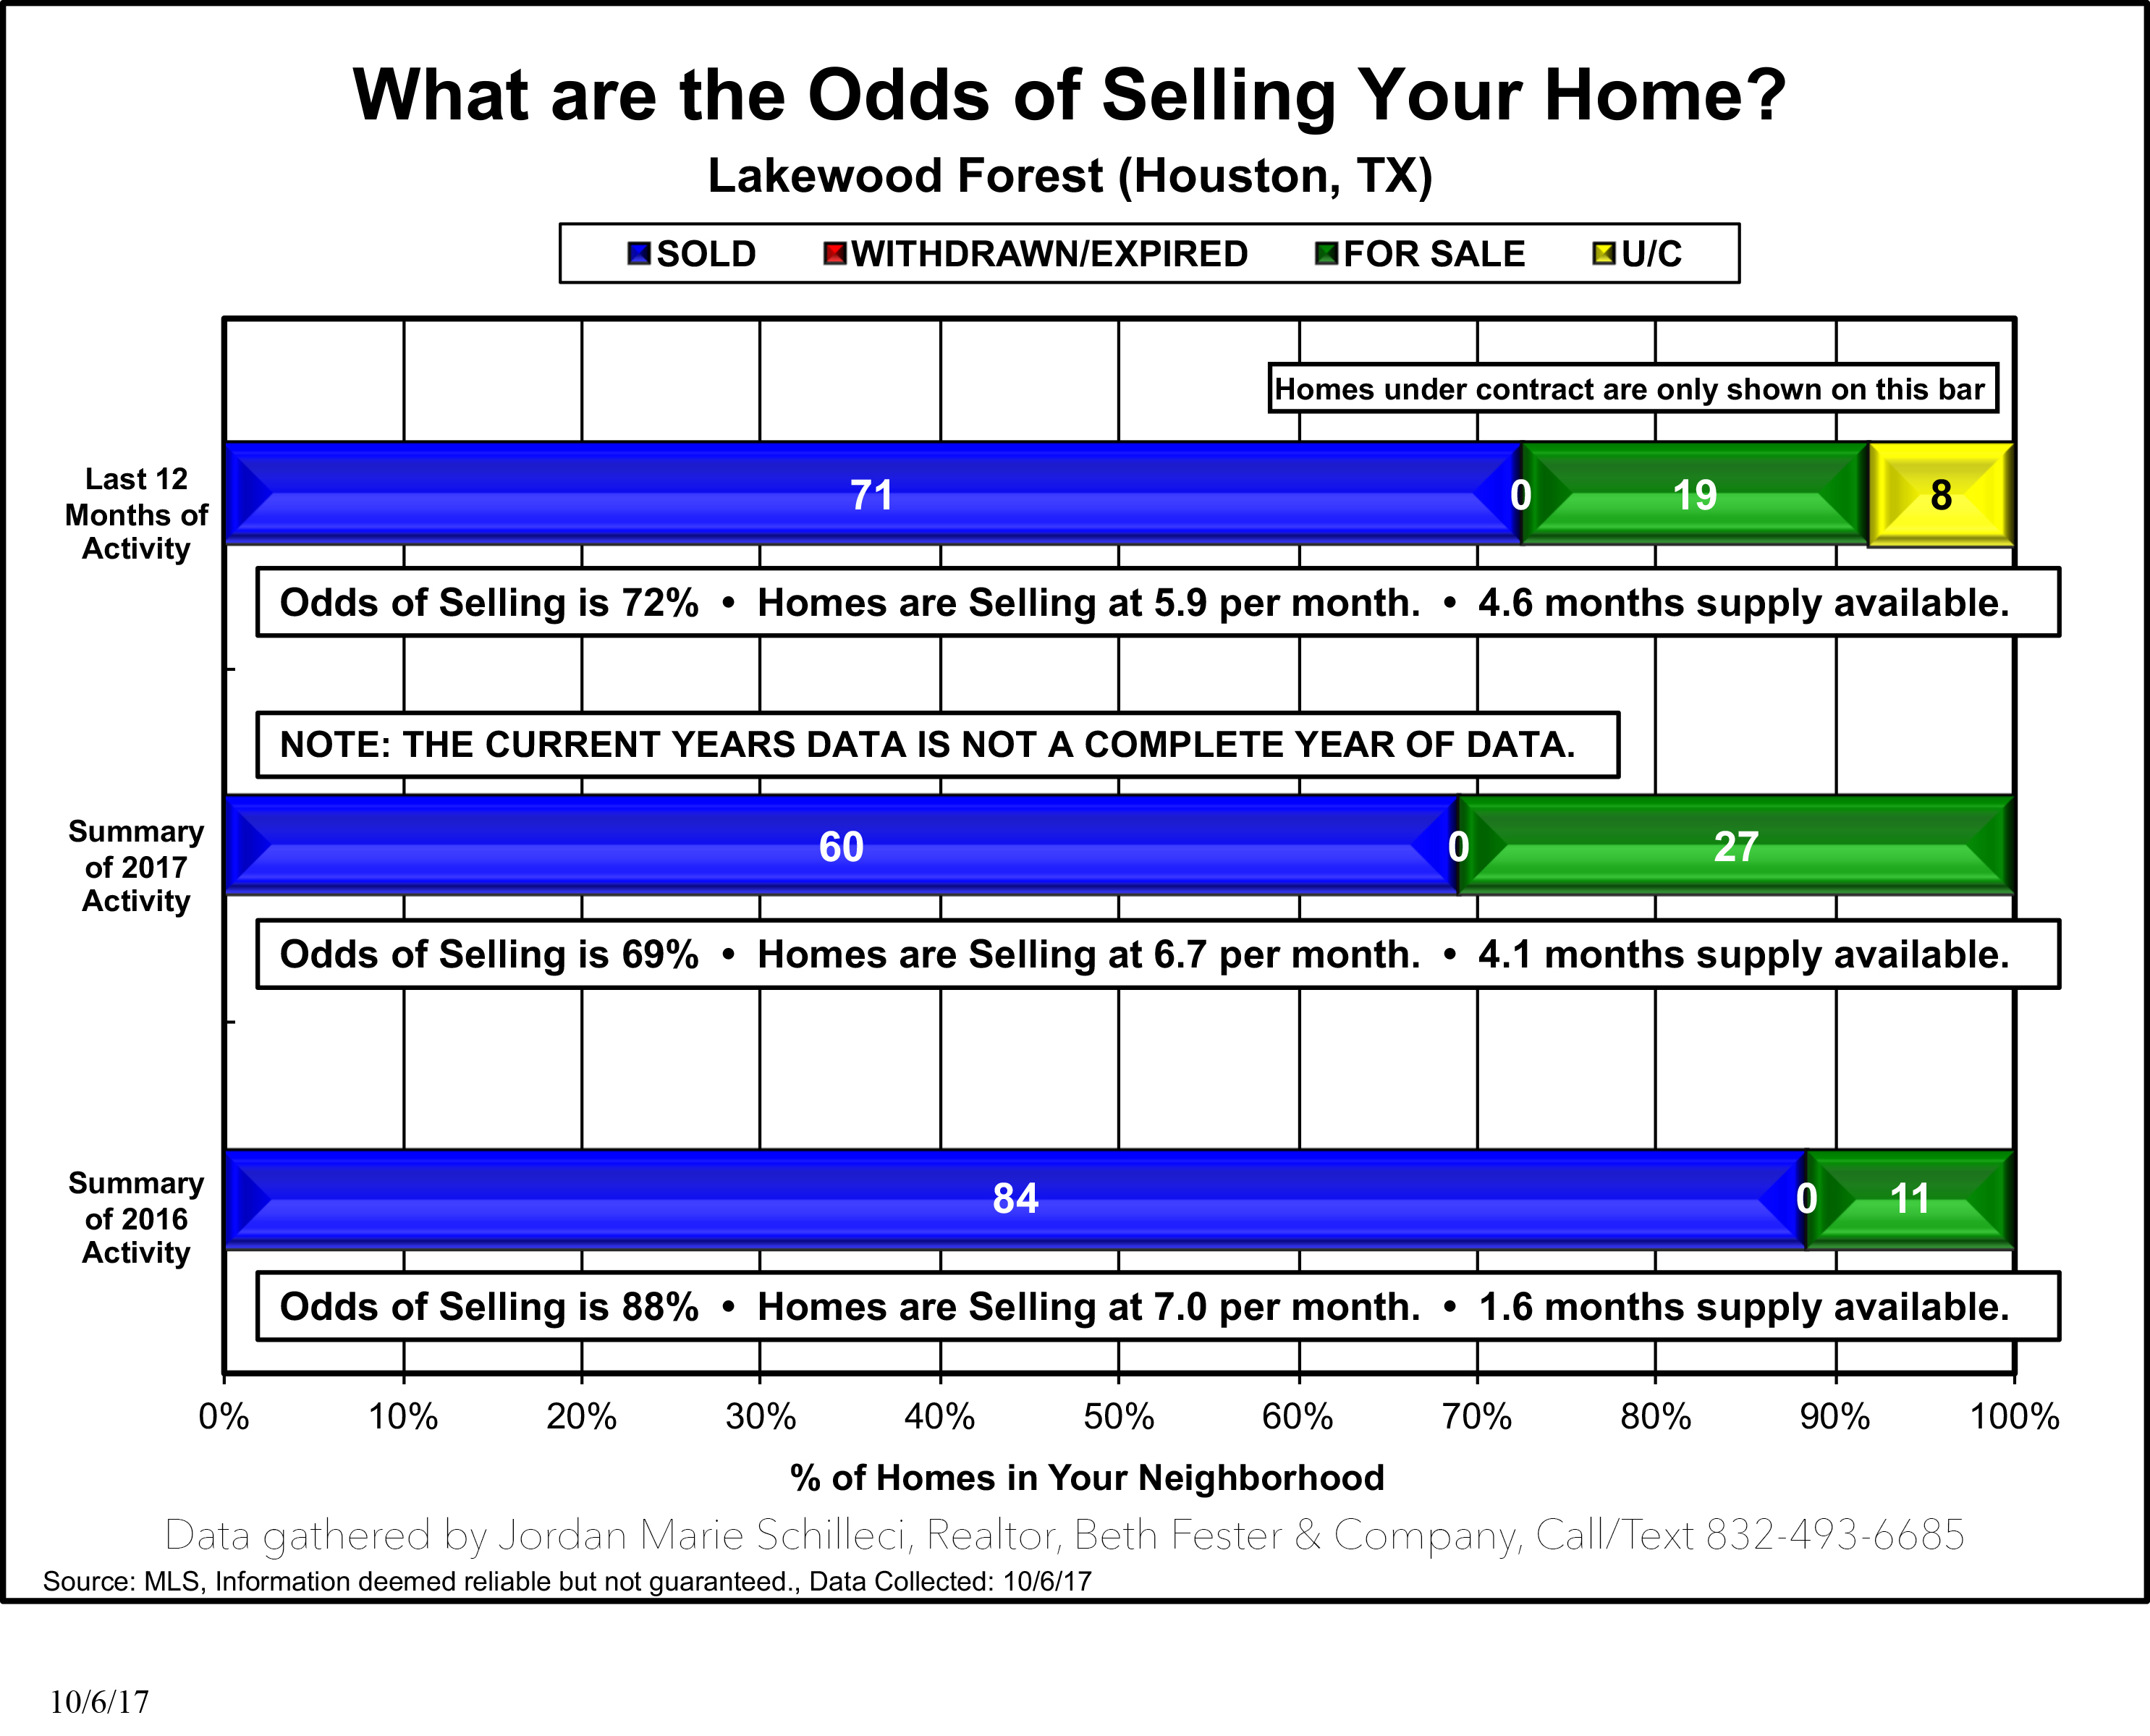
As you can see the inventory here is a lot less than The Heights. There are 19 houses currently for sale and 71 have sold in the last 12 months, making the inventory at 4.6 months. Even though this number appears high, I personally would say the inventory in Lakewood Forest is low, because 11 of those 19 came on the market in 2016. So if you have been considered selling our house in that area, and your house is in great condition, I would recommend putting it on the market soon.

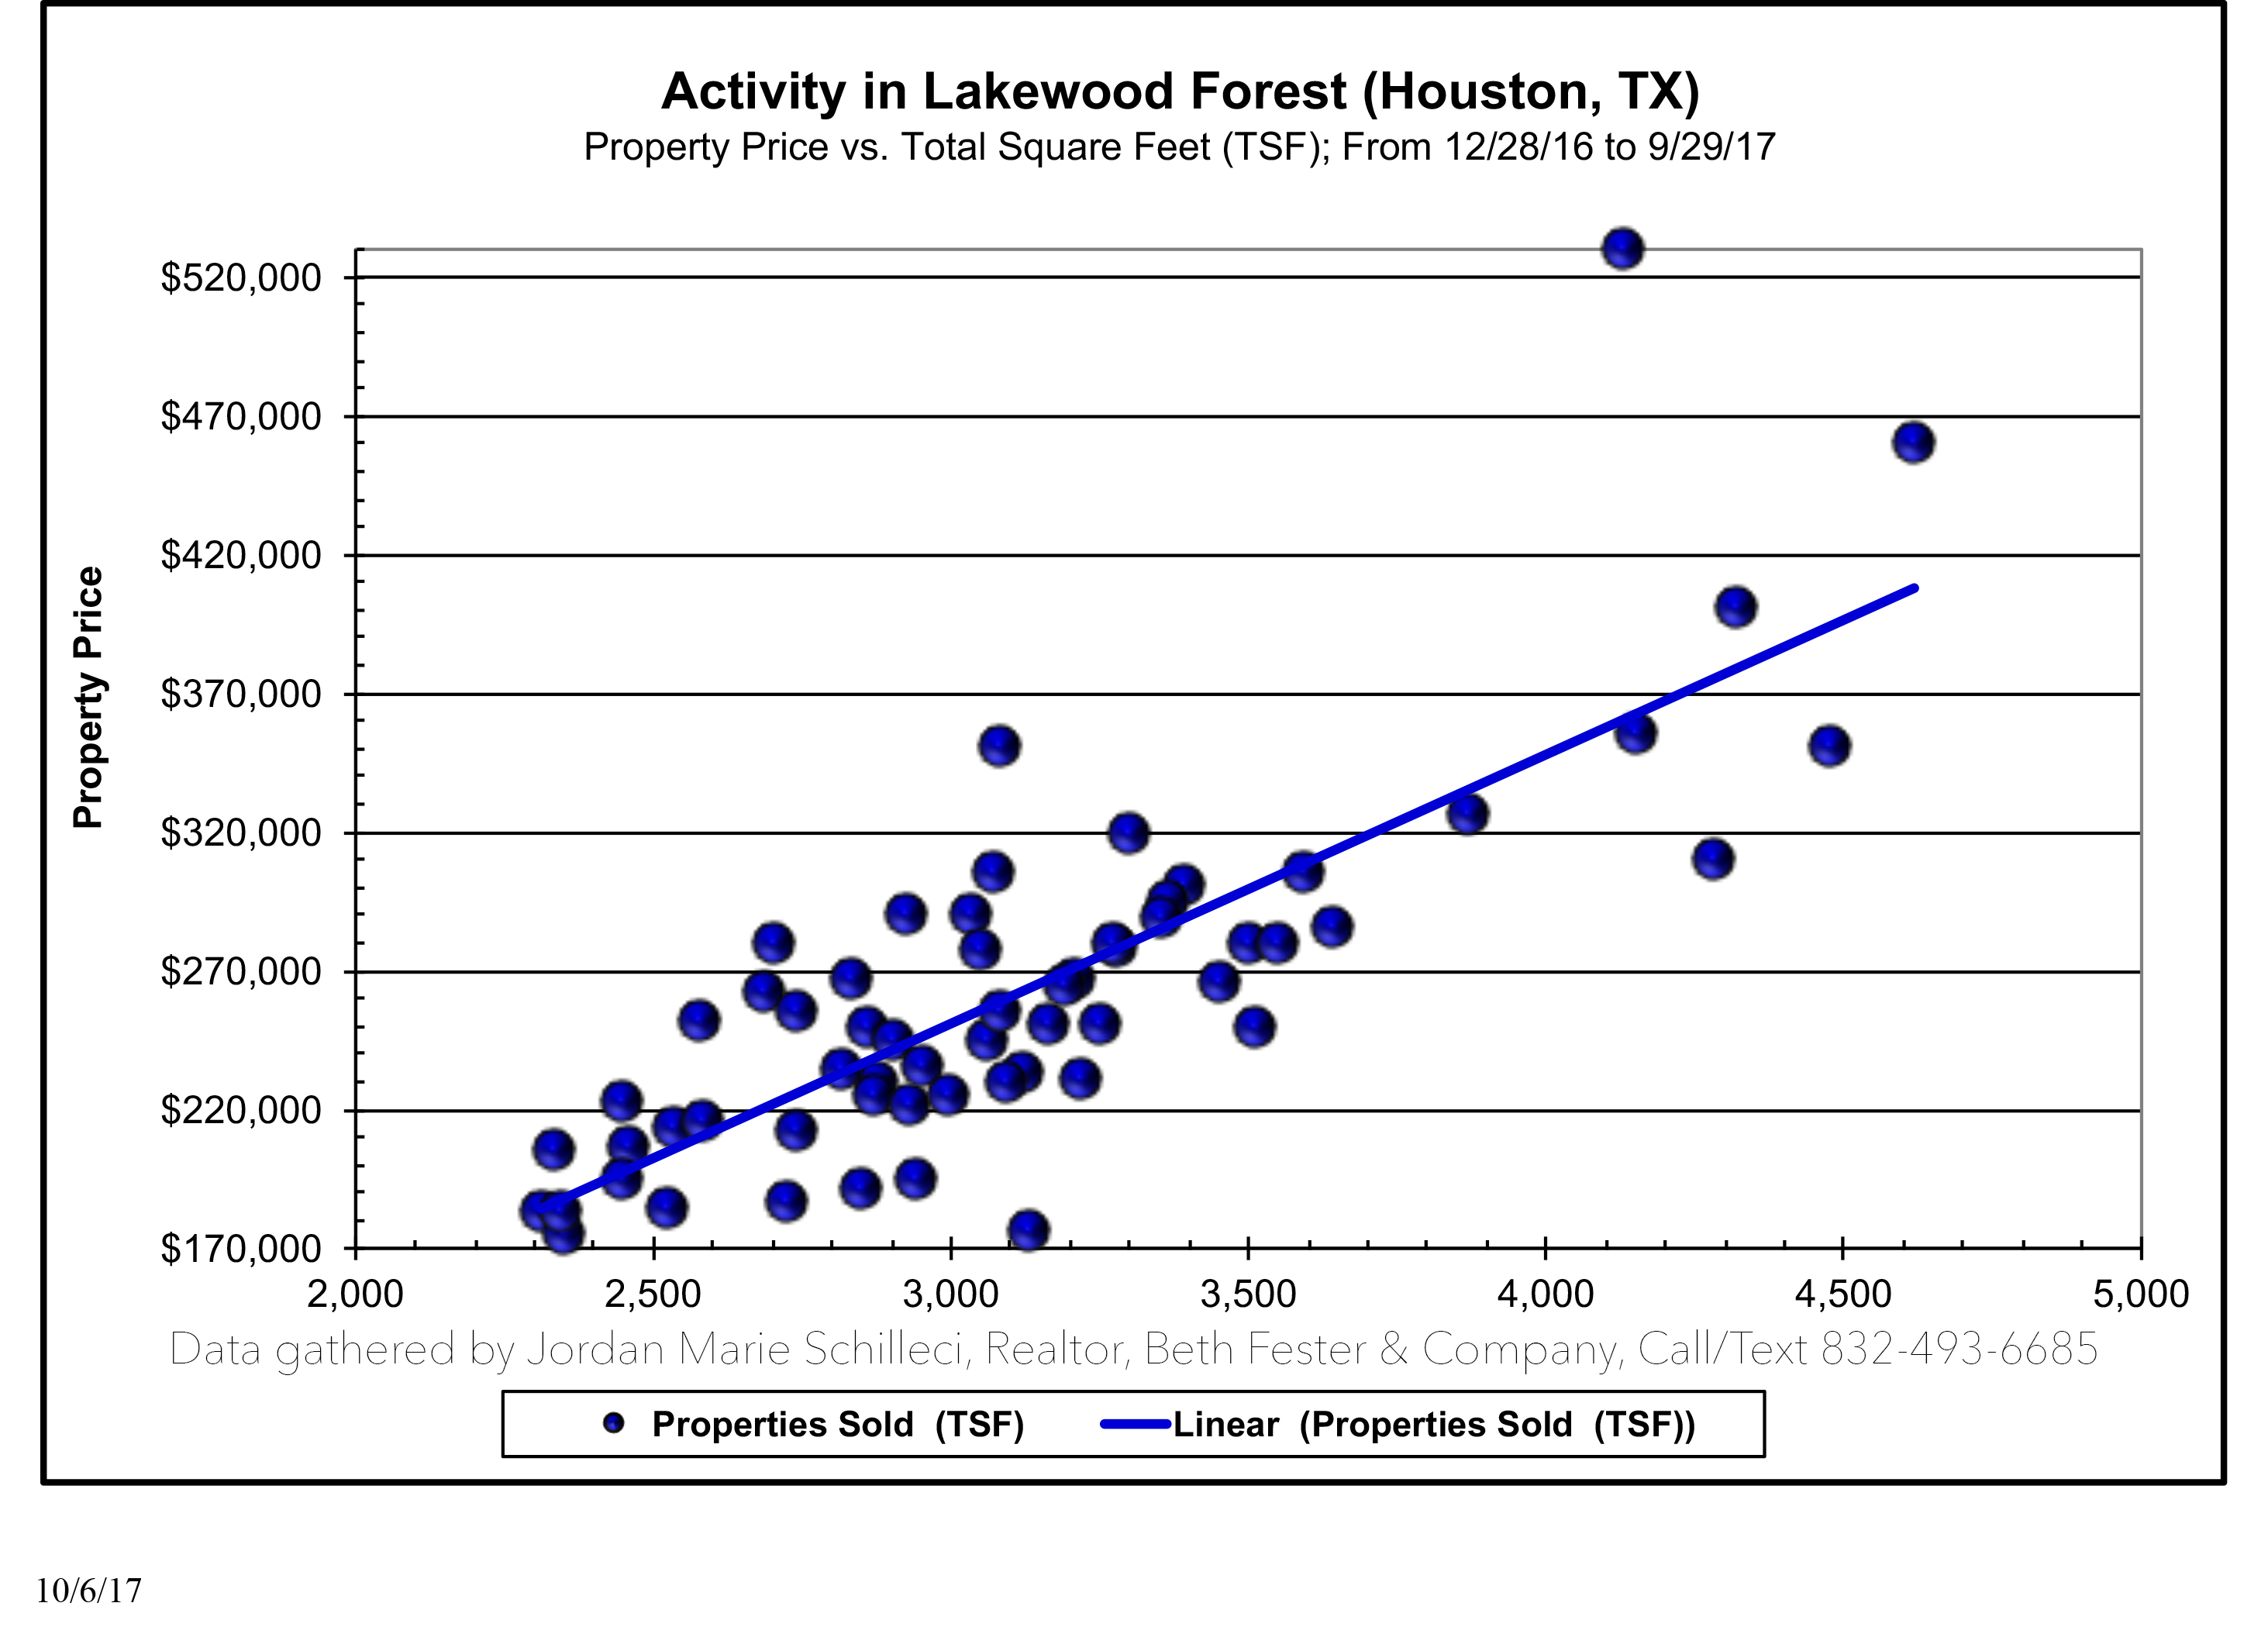
Above, you can see the last 12 months of sold home prices. One thing to remark is the least expensive home was $170,000 (not very low) and the most expensive home went up to $520,000. A very strong neighborhood, especially considering its age and location. If you are thinking about selling you can use this graph, and find along the line, about what you house MIGHT sell for. Again, I can compute estimates specific to your home, just let me know.
Something odd to note, is that the average days on the market between this year and last year. Last year, it was 40 and this year, it increased to 42. I still think it is an amazing neighborhood. You are a little close to the creek, but many of the homes were safe during Hurricane Harvey.
So, let me know if you would like any custom data. Until tomorrow..
Your Realtor,
Jordan Marie Schilleci, REALTOR®
Beth Ferester & Company
Call/Text 832-493-6685

