Yesterday, I was speaking with a good friend of mine, our daughters attend the same elementary school, and we often host playdates/sleepovers/etc. for the girls, well, we were talking real estate, he is a lender, and he brought up the city of Shenandoah yesterday. It haven’t ever pulled the numbers for Shenandoah, so I thought today’s market update would be the perfect time!

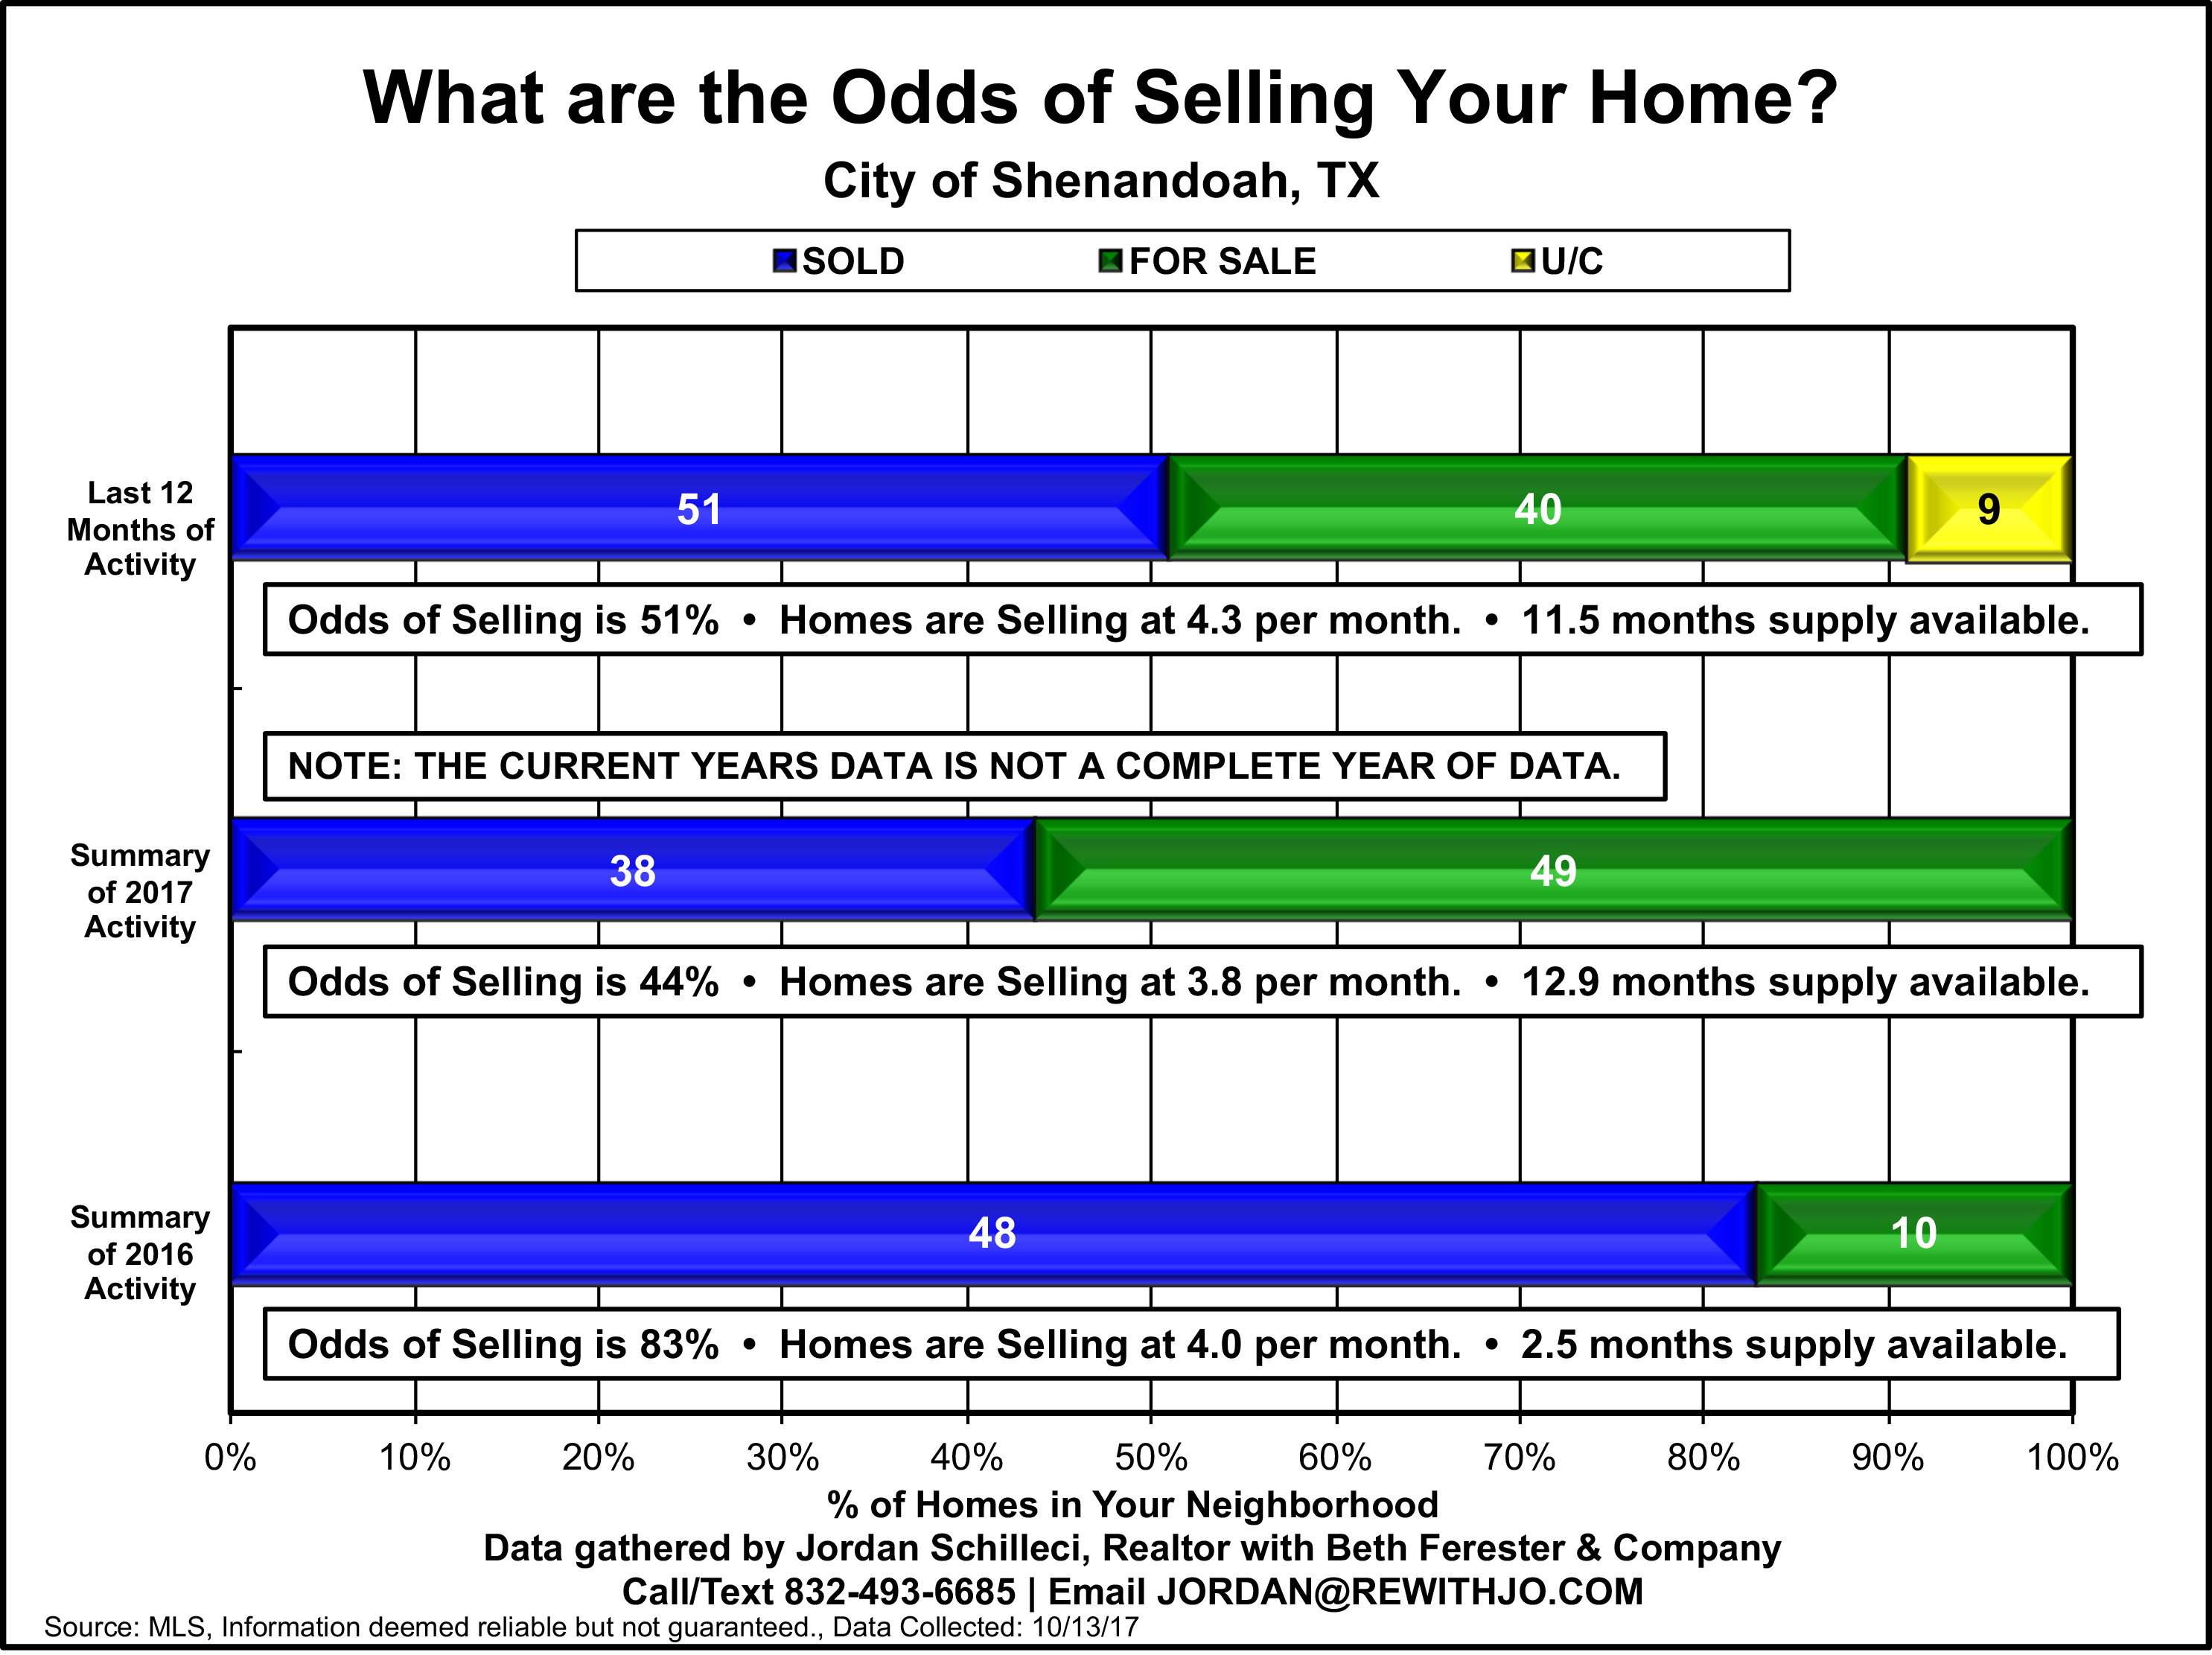
As you can see above, the “months of supply” in Shenandoah is quite high, this is due to the amount of listings and the average amount of homes selling her month. So there are currently 40 homes active on the market, with an additional 9 pending, that should close before the end of the year. But the good news, is an assumption I am going to make. I assume that the 2017 activity (sold homes in the year) will surpass the 48 homes that were sol in 2016, so that is awesome!
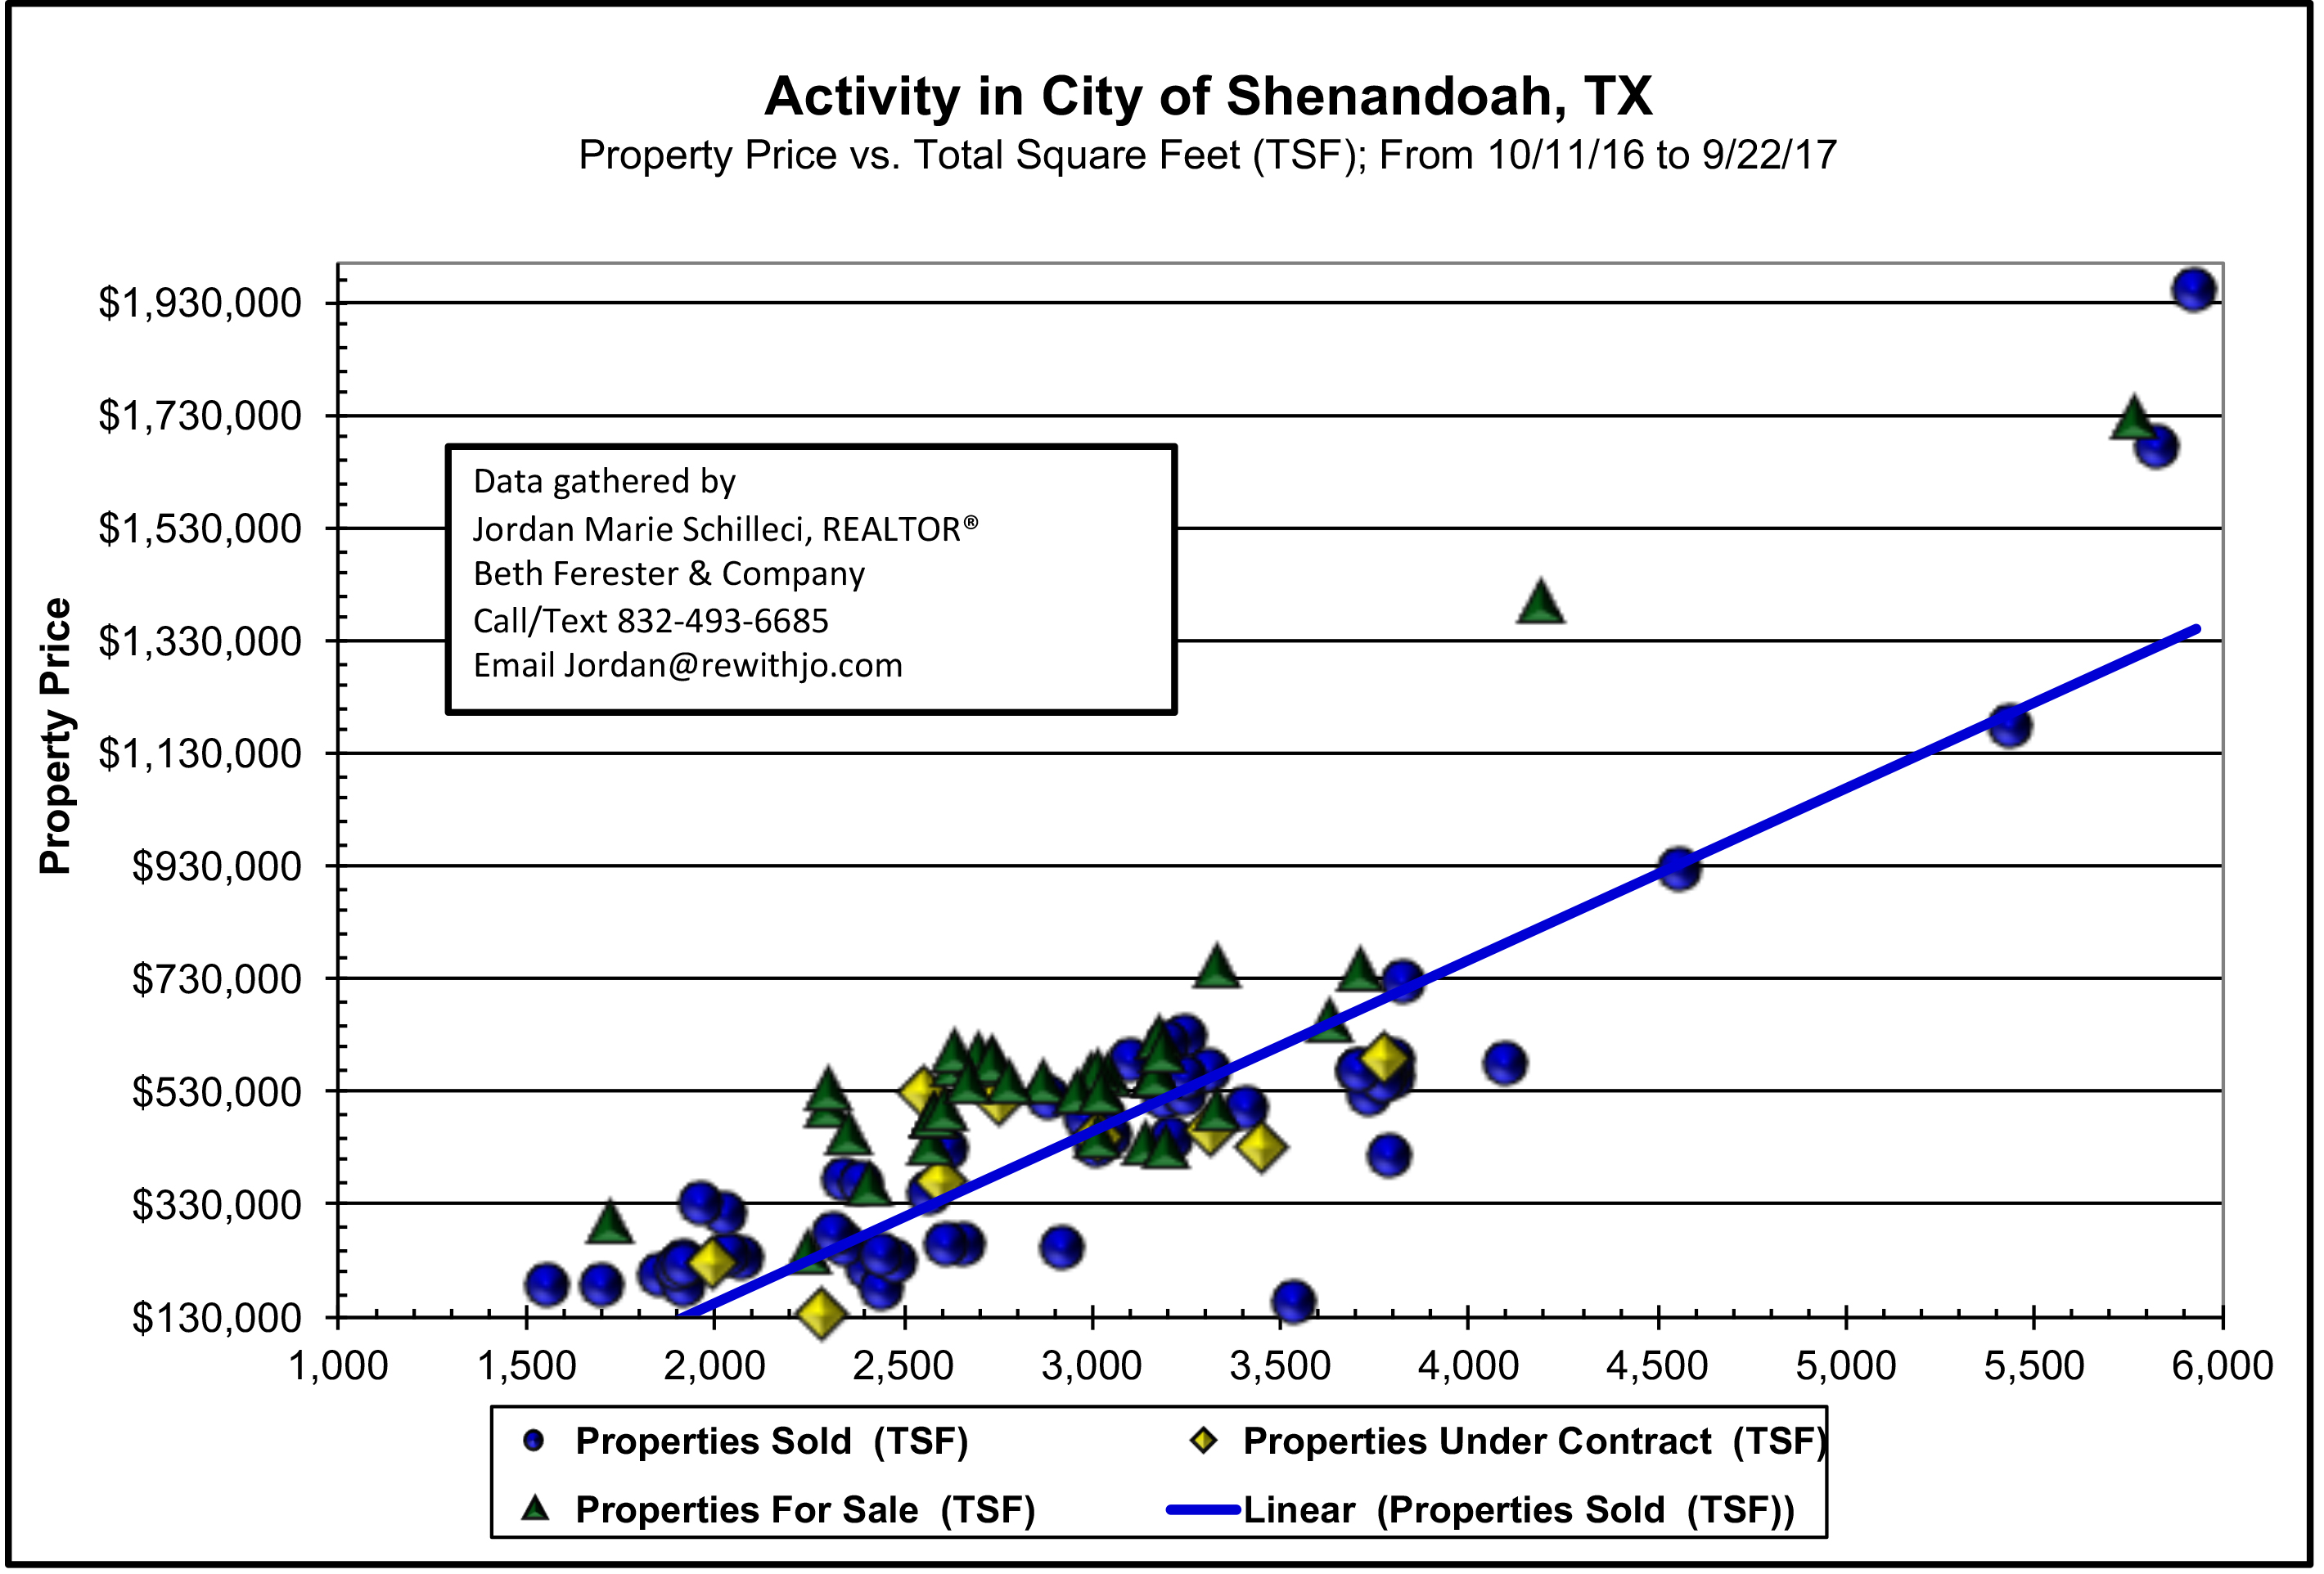
Next is my favorite graph, the scattergram. This helps you visualize the pricing. I have included the last year of data and all the homes currently on the market..

From a quick glance, it appears that most of the properties currently on the market are above the line, but this graph doesn’t take into consideration the age of the home or the condition. But it still gives you an estimate of what you could expect to sell or purchase a home for in the area when comparing the square feet to price.
If you would like some more specific data, please reach out to me. 🙂
Your Realtor,
Jordan Marie Schilleci, REALTOR®
Beth Ferester & Company
Call/Text 832-493-6685

